December 23-27, 1870 - "a 5.9 inch snow with forty-mile-an-hour
winds dropped the termometer below zero for five consecutive days from December 23-27,
1870, with the low of minus 9 on Christmas Day." -Fletcher
Jan. 7-8, 1874 - 11.7" at Detroit
Feb. 28-March 1, 1875 - 14" at Detroit.
Jan. 31-Feb 1, 1878 -- 15.7" at Detroit
January 31 - February 1, 1881- 12.5" at Detroit.
Feb. 12-13, 1884 - 12.8" at Detroit.
April 6, 1886 - greatest snowfall ever in Detroit history with 24.5 "
at Detroit and 20.2 " at Sandusky, OH, and 9.8 " at Toledo.
February 12, 1894 - 7" of snow at Toledo, wind gusts to 60mph source: "Thunder in the Heartland"
March 3-4, 1895 - 12.3" at Detroit.
December 4-5, 1898 - 10.6" at Detroit.
March 4-5, 1899 - 11.4" at Detroit
February 3-4, 1900 - 10" to 11.2" at Detroit.
Feb. 13, 1900 - 12.6" at Detroit.
February 28 - March 1, 1900 - 22" at Toledo; this was the greatest storm total snowfall ever in Toledo history. 14" fell at Detroit.
This storm also brought heavy snowfall (10" or more) at Chicago, Cleveland, Erie, Buffalo, and Rochester. (Source: Toledo Blade).
Snowfall Map
March 4-5, 1900 - 16.1" at Detroit
In March 1900, Detroit had 20-30"
and Toledo had 10". 20-30" was noted for most of New York State, and 10"
was across a large part of the Appalachians, Chicago, Michigan,
Wisconsin, and Minnesota. Overall, from February to March 1900, Toledo had 32.4" of snow
and Detroit had 58.4" of snow.
February to March snowfall (USA)
February to March snowfall (Midwest)
Feb. 3-4, 1901 - 11.2" at Detroit.
Feb. 12-16, 1905 - "The worst Wood County February blizzard occurred from February 12-16, 1905, with the snow totaling only eight inches but with very high drifts and morning lows from minus 8 to 15 degrees below zero." - Fletcher
January 13, 1910 - 12" of wet snow fell in Toledo. 11.4" fell at
Detroit. Toledo Blade quotes: 12"
of snow plays havoc in city and environs. [Mid]west is tied up
by
storm's grasp. Not in
10
years has Toledo been so completely buried. Passengers stalled
in
drifts and business in chaos as tempest subsides. Chicago in
serious
need of milk, coal, other supplies.
"A three-day storm left fifteen inches of snow [in Bowling Green] from
January 12-14 in 1910,
but temperatures stayed near freezing." -Fletcher
Feb. 9, 1911 - 12.3" at Detroit.
February 21, 1912 -"11" by early afternoon"- Wind gusts to 48mph. source: "Thunder in the Heartland." This became a bomb cyclone tracking from Texas to Kentucky to northern New England. 12.4" of snow fell at Fort Wayne.
November 9-11, 1913 - "Great Storm" or "White Hurricane," or
"Great
Lakes Hurricane."
6" of snow fell in Toledo, there may have been true blizzard
conditions, but I am not sure. This was one of the storms of the
century in Great Lakes and Ohio Valley history. It all started
on
November 7 in the northern Great Lakes as some type of clipper.
This
had a development similar to the 1950 storm track - bomb cyclone
from
Virginia to Lake Huron, but basically involved a northwesterly
gale
and falling temperatures in this region for much of the time.
This
was noted by a meteorologist at the Weather Bureau as the most
impressive wind and snow storm in Toledo in many years. quotes
from
the Toledo Blade:
November 10:
Unseasonable Snow Storm Cramps Wire and Car Lines
Ohio, West Virginia, and Pennsylvania Storm Swept.
Extraordinary snowfall recorded in all points available in Ohio,
West
Virginia, and Western Pennsylvania. Beginning with a
light rain early Saturday morning the temperature dropped
slightly.
Before daylight Sunday morning it began to grow colder and rain
turned to sleet and then to snow. The velocity of the wind rose
rapidly and by noon yesterday assumed the proportions of a gale.
Food Runs Short as Cleveland lies Helpless after Gale
Trains stalled in drifts
transportation and wire service hit hard by storm
Records which have been held for 24 years have been broken. The
temperature dropped from 45 to 22 degrees in less than 15 hours
30 to 45mph wind accompanies storm making large drifts, at other
points leaving the ground clear
4.5" of snow and 0.66" of total precipitation (liquid)
The first big
snowstorm-heaviest so
early in the season in the history of the Weather Bureau [Toledo
W.B.
Office]
Overwhelming ruin wrought by storm on land and lakes. Tremendous
surf
destroys hundreds of thousands of dollars worth of property
along
Chicago water front
Big steamers in distress and smaller craft are broken up.
Ohio, Pennsylvania, and West Virginia hit hard by gales and deep
snow, traffic blocked and wires are down
Gale Smashes into Shipping
Vessel Accidents Reported Today
Latest on Lake Disasters
November 12:
Diver tries to learn name of lost vessel, believe it is Regina
Storm is called worst in history of Lake trade
Books about this storm:
The
White Hurricane: A Great Lakes November Gale and America's
Deadliest
Maritime Disaster
January 12, 1918 - Blizzard of 1918 - A true cold wave, one of
the
storms of the century for the Great Lakes and Ohio Valley, wind
30mph
with wind gusts to 50 mph, temperatures fell from 28 to -15
degrees
in 8 hours in western Ohio. 6.5 " total snowfall with true
severe
blizzard conditions. Temperatures were -10 to -20 by the
afternoon
and most of Ohio was -20 or below on the morning of January 13.
This
storm also affected Chicago with a lot of snow and severe
blizzard
conditions. It was a south to north track bomb cyclone similar
to
blizzard of 1978. Maximum wind speed of 63mph from the southwest
at
Toledo on January 12th was reported in Monthly Weather Review,
January 1918. Monthly Weather Review also reported that the
minimum
temperature of the month at Toledo was -15 degrees on the 12th
and at
Fort Wayne, -24 degrees on the 12th. Toledo Blade headlines from
January 12, 1918: "Worst
Blizzard of years sweeps the Middle West. The severest cold wave
and
blizzard of many years gripped the country Saturday. Twenty
degrees
below zero was the rule in Ohio and surrounding territory"
"Chicago
shut off from world."
"Back in the extremely cold winter of 1918, a severe blizzard commenced
on January 10th
and dumped five inches of snow in drifts ten feet high and dropped the
temperature to 18 degrees
below zero. In addition, the thrmometer fell from 24 degrees above zero
to 18 degrees below zero
from darkness to daylight on January 12. Bowling Green had no trains"
-Fletcher
"Friday, January 12, Bowling Green had no trains on either railroad ...
no newspapers
and, with poles down, most phones were dead." -Fletcher
NWS Daily Weather Map
December 13-14, 1922 - 10" at Detroit.
May 9, 1923 - 4", with some people reporting 5" or 6". "Spring and Winter Collabrate on Fleeting Masterpiece of Rare Beauty" - headline in Toledo Blade. This was the latest 4" snowfall ever at Toledo. This storm affected all of Southeast Michigan with 6 " or more, up to a foot at Saginaw.
January 13-14, 1927 - 12.1" at Detroit.
December 18-19, 1929 - 13.8" at Detroit
March 7-8, 1931 - 11.1" at Detroit.
March 21-22, 1932 - 9.5" at Detroit.
November 16, 1932 - largest November snowstorm (snowfall-wise)
for
northwestern Ohio - 10" to 15" fell in northwestern Ohio. 11.5"
fell
at Toledo. A low on the front from Georgia tracked to western
Pennsylvania. Quotes from Toledo Blade: Mercury drops to 19 after heavy snow
blankets district; Traffic lines reopened. 28 degrees at noon
Thursday.
March 26-27, 1934 - 9.2" at Detroit.
December 25, 1935 - Christmas blizzard and cold wave. 3" to 5"
fell
across Ohio, temperatures dropped from 21 to 2 degrees in two
hours,
then down to -1 degrees at 6pm on Christmas, then up to 15
degrees by
midnight, wind gusts more than 30mph. Quotes from Toledo Blade: Mercury Reels Dizzily in Freak Zero
Blast. Havoc was spread by freakish sub-zero cold
wave and
blizzard Christmas Day which passed as rapidly as it
arrived. Although Toledo escaped the worst effects
of the
sudden blizzard, the countryside was piled up by drifted snow.
13
lives lost in frigid cold wave [across the U.S.]
January 19, 1936 - 14" at Marietta, OH, on the border with West
Virginia.
January 29-30, 1939 - 8.9" at Detroit.
February 13-14, 1940 - Southeast and Mid-Atlantic Snowstorm.
This low pressure system was a 1009mb low near Nashville on Feb. 13,
a 984mb low near Washington DC on Feb. 14, and a 965mb low in the
Atlantic Ocean south of New England on Feb. 15.
(drop of 44 mb in 48 hours). Southeast Ohio got over 6" of snow.
7" of snow at Cincinnati and 5" at Columbus. For the month of February
1940, MWR reports 10.1" at Cincinnati , 10.4" at Columbus, 6.5" at
Dayton, and 13.7" at Parkersburg WV.
March 10, 1949 - 6" at Toledo
March
9 snowfall
contour (courtesy NCDC)
March
10 snowfall
contour (courtesy NCDC)
March
9, 1949 12z
Surface temperature and Sea Level Pressure
March
9, 1949 12z 500mb
vorticity
March
9, 1949 12z
(approx. mid level cloud amount and wind)
January 6, 1950 - 6" at Toledo
January
6 snowfall
contour (courtesy NCDC)
January
6, 1950 12z
Surface temperature and Sea Level Pressure
January
6, 1950 12z 500mb
vorticity
January
6, 1950 12z
(approx. mid level cloud amount and wind)
November 23-27, 1950 - Blizzard of 1950. This was one of the
storms of the
century for the Great Lakes, Ohio Valley and Northeast and
Mid-Atlantic - 3 to 6.5" at Toledo, true blizzard conditions, a
very cold 3
degrees F on the Friday November 24, the day after Thanksgiving.
Wind
gusts to 55mph. super upper level closed low with clipper-type,
true
cold wave, and with wave on cold front in North Carolina and
bomb
cyclone with a retrogression from Virginia to Pennsylvania to
Ohio.
(also known as the Thanksgiving Weekend Storm, the Great
Appalachian
Storm, and the OSU-Michigan Snow Bowl)
quotes from Toledo Blade:
November 25:
Snow Paralyzes Eastern U.S.
Three
large cities tied up.
Heavy wind drives cold and snow into Toledo
Drifts up to 2 feet east of city cause bus schedule cancellation
5-10 degree low predicted tonight
3-5" fell
Tugboat rescued by Coast Guard in storm
November 26:
Toledo - all plane flights cancelled and train service sharply
curtailed
Northwest Ohio - several major highways
closed
People stranded
Worst blizzard since '13 ties up Northeast Ohio. 12 -
28"
reported
November 27:
6" storm total
Snow still isolates rural areas in Northwest Ohio
November
22 snowfall
contour (courtesy NCDC)
November
23 snowfall
contour (courtesy NCDC)
November
24 snowfall
contour (courtesy NCDC)
November
25 snowfall
contour (courtesy NCDC)
November
26 snowfall
contour (courtesy NCDC)
November
27 snowfall
contour (courtesy NCDC)
November
28 snowfall
contour (courtesy NCDC)
November
24 low
(minimum) temperature (courtesy NCDC)
November
25 high
(maximum) temperature (courtesy NCDC)
November
23 peak wind gust
(courtesy NCDC)
November
24 peak wind gust
(courtesy NCDC)
November
25 peak wind gust
(courtesy NCDC)
November
26 peak wind gust
(courtesy NCDC)
November
24, 1950 12z
Surface temperature and Sea Level Pressure
November
24, 1950 12z
500mb vorticity
November
24, 1950 12z
(approx. mid level cloud amount and wind)
November
25 12z 850mb
temperature and Sea Level Pressure
January 31 - February 1, 1951 5.5" at Toledo.
January
31 snowfall
contour (courtesy NCDC)
February
1 snowfall
contour (courtesy NCDC)
January
31, 1951 12z
Surface temperature and Sea Level Pressure
January
31, 1951 12z
500mb vorticity
January
31, 1951 12z
(approx. mid level cloud amount and wind)
November 6-7, 1951 - 4.5" at Toledo
November
6 snowfall
contour (courtesy NCDC)
November
7 snowfall
contour (courtesy NCDC)
November
6, 1951 12z
Surface temperature and Sea Level Pressure
November
6, 1951 12z
500mb vorticity
November
6, 1951 12z
(approx. mid level cloud amount and wind)
December 14, 1951 - 4.6" at Toledo
Decmeber
14 snowfall
contour (courtesy NCDC)
December
14, 1951 12z
Surface temperature and Sea Level Pressure
December
14, 1951 12z
500mb vorticity
December
14, 1951 12z
(approx. mid level cloud amount and wind)
December 24-25, 1951 - 9.9" on Christmas, the greatest Christmas
snowfall ever at Toledo ended the calendar year with around 60"
of
snow for the year. Toledo Blade quotes: 9.7 inch Snow Shatters Records. Traffic
Slowed. The latest in a relentless series of Midwest snowstorms.
The
storm hurried eastward to blast New England after dumping an
additional 8 " in most of the Midwest. [additional meaning on
top of
December 23 snow depth]
Snowfall Contour
December
25, 1951 12z
Surface temperature and Sea Level Pressure
December
25, 1951 12z
500mb vorticity
December
25, 1951 12z
(approx. mid level cloud amount and wind)
February 6, 1952 - 5.1 "
February
6 snowfall
contour (courtesy NCDC)
February
6, 1952 12z
Surface temperature and Sea Level Pressure
February
6, 1952 12z
500mb vorticity
February
6, 1952 12z
(approx. mid level cloud amount and wind)
December 14, 1953- 6 " at Toledo. Look at that upper low in
Kentucky
and Missouri (see maps)
December
14 snowfall
contour (courtesy NCDC)
December
14, 1953 12z
Surface temperature and Sea Level Pressure
December
14, 1953 12z
500mb vorticity
December
14, 1953 12z
(approx. mid level cloud amount and wind)
February 24 - March 4, 1954 - measureable snowfall on every day
but
March 2nd. Easterly gales (two storms) - 5.9 " in Toledo on
February
28 and March 1st (10.9 " at Cleveland on March 1) 4.7" in Toledo
on
March 3rd and 4th. The 9-day total snowfall was 13.8" from
February
24th to March 4th. Toledo Blade quotes: March 3: Near Blizzard hits area; Storm
worst in years at Chicago; Travel Hazardous. 18-inch drifts pile
up
on roads; cold sweeps in. Most rural schools closed; adrian has
fall
of 6", State Patrol warns motorists. 3" at 8:00AM. 12-inch
snowfall
at Chicago. Snowfall heaviest in a single storm since 14.9" fell
in
Chicago on January 30, 1939. A wind-driven snowstorm, the second
in
35 hours whipped across the south central portion of Michigan
today
closing schools, snarling traffic. 9 " at Hillsdale, 3-5 at
Grand
Rapids, 6 to 7" at Monroe, 4 to 5" at Detroit, 8" at Flint.
March
5: Cleveland reeling from 5 straight days of
storms. 20.8 " fall [at Cleveland.] Busses 'lost.'
Toledo
gets more snow, drifts pile up. An additional inch of snow fell
on
Toledo yesterday while winds up to 43 miles an hour continued to
pile
up drifts.
February
25 snowfall
contour (courtesy NCDC)
February
28 snowfall
contour (courtesy NCDC)
March
1 snowfall
contour (courtesy NCDC)
March
2 snowfall
contour (courtesy NCDC)
March
3 snowfall
contour (courtesy NCDC)
March
4 snowfall
contour (courtesy NCDC)
March
1, 1954 12z
Surface temperature and Sea Level Pressure
March
1, 1954 12z 500mb
vorticity
March
1, 1954 12z
(approx. mid level cloud amount and wind)
March 29, 1954- 6 " in Toledo, 6 " in Detroit, and 8" in
Jackson. A
slow moving front was south of Toledo in southern Ohio and
Indiana,
lined up WSW to ENE. Toledo was at freezing during this storm.
March
29 snowfall
contour (courtesy NCDC)
March
30, 1954 00z
Surface temperature and Sea Level Pressure
March
30, 1954 00z 500mb
vorticity
March
30, 1954 00z
(approx. mid level cloud amount and wind)
Janurary 8-10, 1957 - 7 to 8" at Toledo, 9" at Detroit.
January
9 snowfall
contour (courtesy NCDC)
January
10 snowfall
contour (courtesy NCDC)
January
9, 1957 12z
Surface temperature and Sea Level Pressure
January
9, 1957 12z 500mb
vorticity
January
9, 1957 12z
(approx. mid level cloud amount and wind)
April 7-8, 1957 - There were easterly and northeasterly gales,
and 10
" of snow. This was greatest April snow event ever in Toledo.
Quotes
from the Toledo Blade: Record
April
Snowfall Downs Electric Lines, Forces School Closings.
April
7 snowfall
contour (courtesy NCDC)
April
8 snowfall
contour (courtesy NCDC)
April
8, 1957 12z
Surface temperature and Sea Level Pressure
April
8, 1957 12z 500mb
vorticity
April
8, 1957 12z
(approx. mid level cloud amount and wind)
February 15, 1958 - 6" of snow in Toledo. Strong low in the
Southeast with a strong upper level trough that became a coastal
low.
Apparently Detroit, Fort Wayne and Findlay did not get more than
2"
from this storm, but it was significant for the East Coast.
Ranked
#10 in terms of the NESIS
February
11-17 snowfall contour
February
15, 1958 12z
Surface temperature and Sea Level Pressure
February
15, 1958 12z
500mb vorticity
February
15, 1958 12z
(approx. mid level cloud amount and wind)
February 25, 1960 - 6" at Toledo. A low tracked from lower
Mississippi Valley to
Ohio.
Maps
February
24 snowfall
contour (courtesy NCDC)
February
25 snowfall
contour (courtesy NCDC)
February
25, 1960 12z
Surface temperature and Sea Level Pressure
February
25, 1960 12z
500mb vorticity
February
25, 1960 12z
(approx. mid level cloud amount and wind)
March 3, 1960 - 6" at Toledo, 11.5" at Cleveland. Mid-Atlantic
and
Northeast major bomb cyclone snowstorm. Ranked #6 in terms of
the
NESIS
Maps
March
2 snowfall
contour (courtesy NCDC)
March
3 snowfall
contour (courtesy NCDC)
March
4 snowfall
contour (courtesy NCDC)
March
3, 1960 00z
Surface temperature and Sea Level Pressure
March
3, 1960 00z 500mb
vorticity
March
3, 1960 00z
(approx. mid level cloud amount and wind)
February 21, 1962 - 6 "
Maps
February
20 snowfall
contour (courtesy NCDC)
February
21 snowfall
contour (courtesy NCDC)
February
22 snowfall
contour (courtesy NCDC)
February
21, 1962 12z
Surface temperature and Sea Level Pressure
February
21, 1962 12z
500mb vorticity
February
21, 1962 12z
(approx. mid level cloud amount and wind)
March 5, 1962 - "Ash Wednesday Storm" - 8" at Toledo, 3" at
Cleveland, 8 " at Akron/Canton - "Ash Wednesday Storm" with high
winds/waves coastal flooding on March 6 on the East Coast and a
major
snowstorm for the Appalachians. Cutoff upper low.
Maps
March
4 snowfall
contour (courtesy NCDC)
March
5 snowfall
contour (courtesy NCDC)
March
6 snowfall
contour (courtesy NCDC)
March
5, 1962 12z
Surface temperature and Sea Level Pressure
March
5, 1962 12z 500mb
vorticity
March
5, 1962 12z
(approx. mid level cloud amount and wind)
December 6-7, 1962 - 5 to 6". Strong deepening low pressure in
Virginia and a strong closed upper level low in Kentucky.Quotes from Toledo Blade: 5 -inch
snowfall snarls traffic, closes schools, cuts power area-wide.
Heavy
wind causes drifting. 7-inch snowfall jams traffic, cuts off
Bowling
Green and Findlay, blamed for 3 deaths. Hardest hit late
yesterday
was the suburban area south of Toledo on a line from Perrysburg
to
Waterville. U.S. 24 between Maumee and Napoleon was closed.
Maps
December
5 snowfall
contour (courtesy NCDC)
December
6 snowfall
contour (courtesy NCDC)
December
7 snowfall
contour (courtesy NCDC)
December
6, 1962 12z
Surface temperature and Sea Level Pressure
December
6, 1962 12z
500mb vorticity
December
6, 1962 12z
(approx. mid level cloud amount and wind)
January 1, 1964 - 7.4 and 7.6" at Cincinnati, with 4.3" at
Toledo.
Maps
December
31,1963
snowfall contour (courtesy NCDC)
January
1, 1964
snowfall contour (courtesy NCDC)
January
1, 1964 12z
Surface temperature and Sea Level Pressure
January
1, 1964 12z 500mb
vorticity
January
1, 1964 12z
(approx. mid level cloud amount and wind)
January 12-13 1964 - honorable mention, 9.5" at Findlay, 8.5" at
Cleveland, 9 " at Akron/Canton, it hit central and eastern Ohio
harder and became a blockbuster noreaster snowstorm. Ranked #12 in
terms of the NESIS.
Maps
January
11 snowfall
contour (courtesy NCDC)
January
12 snowfall
contour (courtesy NCDC)
January
13 snowfall
contour (courtesy NCDC)
January
12, 1964 12z
Surface temperature and Sea Level Pressure
January
12, 1964 12z
500mb vorticity
March 10-12, 1964 - 6.5", 13.6" at Fort Wayne. The low tracked
from
Arkansas to southeast Ohio and southern Pennsylvania and
strongly
intensified. This was a very borderline situation with the
temperature at Toledo and Fort Wayne, with the rain/snow being
probably 20-60 miles away. A second weak low on March 12 hit
Fort
Wayne with extra snowfall.
Maps
March
10 snowfall
contour (courtesy NCDC)
March
11 snowfall
contour (courtesy NCDC)
March
12 snowfall
contour (courtesy NCDC)
March
10, 1964 00z
Surface temperature and Sea Level Pressure
March
10, 1964 00z 500mb
vorticity
December 2-3 1964 - 7" at Findlay, 4.5" at Toledo
Maps
December
2 snowfall
contour (courtesy NCDC)
December
3 snowfall
contour (courtesy NCDC)
December
2, 1964 12z
Surface temperature and Sea Level Pressure
December
2, 1964 12z
500mb vorticity
February 24-26, 1965 - This could be called the "Midwest/Ohio
Valley
Snowstorm of 1965" 7.8" at Toledo, 11" at Detroit, 12.9" at
Flint,
9" at Jackson MI, 10.3 " at Lansing, 17.9" at Saginaw, 7.5" at
Grand
Rapids, 12.7" at South Bend, 7.5" at Fort Wayne, 12.5" at
Indianapolis, 10" at Chicago, 7.6" at Peru IN, 9.8" at
Lafayette,
8.4" at Evansville, 6" Bowling Green KY, 3" Cincinnati, 7"
Paducah. The surface low tracked from Louisiana to Cincinnati to
north of Pittsburgh to north of Montreal. The rain-snow line was
near
a Toledo to Indianapolis line. It was a strongly deepening low
from
around 1002mb to 983mb in 24 hours, to 976mb in 30 hours. It was
12
degrees and windy at Toledo after the storm ended. It is
interesting
to note this situation was along with a strong Greenland block
but
the upper level flow off the East Coast did not allow a coastal
low
to develop. This was a definite problem for transportation in
Toledo,
according to the Toledo Blade. It was also the largest
single-storm
total snowstorm at Toledo in the previous 14 years, according to
the
Toledo Blade.
Maps
February
24 snowfall
contour (courtesy NCDC)
February
25 snowfall
contour (courtesy NCDC)
February
24, 1965 12z
Surface temperature and Sea Level Pressure
February
24, 1965 12z
500mb vorticity
February
24, 1965 18z
(approx. mid level cloud amount and wind)
February
25, 1965 00z
(approx. mid level cloud amount and wind)
February
25, 1965 06z
(approx. mid level cloud amount and wind)
January 22-23, 1966 - 11 " at Akron/Canton. This was a major
interior
Northeast snowstorm and ranks #19 in terms of the NESIS.
Maps
January
22 snowfall
contour (courtesy NCDC)
January
23 snowfall
contour (courtesy NCDC)
January
22, 1966 12z
Surface temperature and Sea Level Pressure
January
22, 1966 12z
500mb vorticity
November 2-3, 1966- This could be called the "Midwest/Ohio
Valley
Blizzard of 1966". 9.6" Toledo, 9.5" at Detroit Willow Run, 6 "
at
Detroit, 8.8 " at Findlay, 9 to 12" in western Ohio, 12.1"
Alpena
11.3" Saginaw, 10.5" Ann Arbor, 10.1" Traverse City, 9.0"
Lansing, 8.6"
Flint, 7.7" Grand Rapids, 6.0" Detroit, 13.1" Louisville, 7.6"
Lexington KY, 8.3" Indianapolis, 6.8" Fort Wayne, 5.8" South
Bend, 2.4"
Evansville, 14.0" Lima, 8.0" Cincinnati, 5.7" Columbus. Wind
gusts 40 to
50mph. I am not sure if it was true blizzard conditions. This
was a
highly amplified upper level flow that involved powerful phasing
and
a really good comma head, with multi-contour 500mb low. The low
pressure center tracked and strongly intensified from the
Florida
panhandle to West Virginia to southern Ontario and western
Quebec
(not a true bomb cyclone).
Maps
November
2 snowfall
contour (courtesy NCDC)
November
3 snowfall
contour (courtesy NCDC)
November
2, 1966 12z
Surface temperature and Sea Level Pressure
November
2, 1966 12z
500mb vorticity
November
2, 1966 12z
(approx. mid level cloud amount and wind)
November
2, 1966 18z
(approx. mid level cloud amount and wind)
November
3, 1966 00z
(approx. mid level cloud amount and wind)
November 29, 1966 - 6.5" at Toledo.
Sinking of
the Daniel J. Morrell on Lake Huron
Maps
November
28 snowfall
contour (courtesy NCDC)
November
29 snowfall
contour (courtesy NCDC)
November
30 snowfall
contour (courtesy NCDC)
November
29, 1966 12z
Surface temperature and Sea Level Pressure
November
29, 1966 12z
500mb vorticity
December 10, 1966 - 5.5" at Toledo. Quotes from the Toledo
Record:
Third Pre-Winter Storm Blamed
in
Two Deaths. Much traffic re-routed. 5 1/2" of snow on top on an
earlier deluge of rain. Considerble flooding continued in
low-lying
areas, particularly in Grand Rapids, OH. November 2-3 left 9
1/2".
Followed by 6 1/2" on November 30.
Maps
December
10 snowfall
contour (courtesy NCDC)
December
10, 1966 12z
Surface temperature and Sea Level Pressure
December
10, 1966 12z
500mb vorticity
January 26-28, 1967 - the Midwest Blizzard of 1967. This was a
Texas
Panhandle type Colorado low that tracked through Arkansas, south
of
St. Louis, and through Ohio, and occluded in Michigan, and most
importantly it seemed to take longer in its occluding stage than
other storms like this. There were warm temperatures in the
eastern
half of the country on January 24-25 when a low tracked through
the
northern Lakes and brought a cold front and also strong high
pressure
to the Midwest that formed a blocking high and the Texas
Panhandle
low formed to the south of it. That slowed the storm and
provided
arctic air just enough to make this a huge snowstorm - the best
ever
for Chicago, South Bend, Flint, Lansing, Ann Arbor, and Saginaw.
Plenty of low level moisture in the Southeast was drawn into the
storm.
Maps
January
25 snowfall
contour (courtesy NCDC)
January
26 snowfall
contour (courtesy NCDC)
January
27 snowfall
contour (courtesy NCDC)
January
28 snowfall
contour (courtesy NCDC)
January
28 snow
depth contour (courtesy NCDC)
January
26, 1967 18z
Surface temperature and Sea Level Pressure
January
26, 1967 12z
500mb vorticity
Milwaukee
NWS
Office - Big snow in the U.S.
February 5, 1967 - 7" at Toledo
Maps
February
5 snowfall
contour (courtesy NCDC)
February
5, 1967 12z
Surface temperature and Sea Level Pressure
February
5, 1967 12z
500mb vorticity
January 13-15, 1968 - 7 ". The Toledo Blade reported 10.3".
Snow,
ice, and rain affected a large area of the country. There was
about
18 " that fell on Mansfield, and 4-8 " were reported in the
surrounding area, according to the Blade, with at least 8" in
Hardin
and Mercer counties in Ohio. It was a multi-contour upper-level
low
that brought an ice storm to parts of Ohio at the beginning of
this
3-day event. Quotes from the Toledo Blade: 10 " of snow blankets area; snow schools
shut, traffic slowed. Kelley's Island had 10" in 4 hours
Saturday
night. Ohio snowfall ranges up to 20 ".
Maps
January
12 snowfall
contour (courtesy NCDC)
January
13 snowfall
contour (courtesy NCDC)
January
14 snowfall
contour (courtesy NCDC)
January
15 snowfall
contour (courtesy NCDC)
January
14, 1968 12z
Surface temperature and Sea Level Pressure
January
14, 1968 12z
500mb vorticity
March 22-23, 1968 - 6 to 7" at Toledo
Maps
March
21 snowfall
contour (courtesy NCDC)
March
22 snowfall
contour (courtesy NCDC)
March
23 snowfall
contour (courtesy NCDC)
March
22, 1968 12z
Surface temperature and Sea Level Pressure
March
22, 1968 12z 500mb
vorticity
December 23, 1969 - 8" at Toledo
Maps
December
23 snowfall
contour (courtesy NCDC)
December
23, 1969 12z
Surface temperature and Sea Level Pressure
December
23, 1969 12z
500mb vorticity
December 31, 1969 - January 1, 1970 - 8.9" at Toledo
Maps
December
31, 1969
snowfall contour (courtesy NCDC)
January
1, 1970
snowfall contour (courtesy NCDC)
December
31, 1969 12z
Surface temperature and Sea Level Pressure
December
31, 1969 12z
500mb vorticity
February 7-9, 1971 - honorable mention, 9"-12" snowstorm for
Cincinnati, Columbus, and Cleveland. Otherwise in Ohio there was
6-9", although less than 1 inch at Toledo. A low in Louisiana
then
Georgia and front along Appalachians, low intensified strongly
and
tracked along East coastal plain. Pretty amplified trough with
strong
straight south-southwest flow at jet level on east side of
trough
along the front. Band of snow south-southwest to
north-northeast.
Maps
February
7, 1971
snowfall contour (courtesy NCDC)
February
8, 1971
snowfall contour (courtesy NCDC)
February
9, 1971
snowfall contour (courtesy NCDC)
February
8, 1971
12z Surface temperature and Sea Level Pressure
February
8, 1971 12z
500mb vorticity
March 17, 1973 - heavy snow in northern Indiana and southern
Michigan
that gave 12.3 " to Fort Wayne and 13 " to Ann Arbor(), 9.9" at
Detroit, 4" at Toledo.
Maps
March
16, 1973
snowfall contour (courtesy NCDC)
March
17, 1973
snowfall contour (courtesy NCDC)
March
18, 1973
snowfall contour (courtesy NCDC)
March
17, 1973 12z
Surface temperature and Sea Level Pressure
March
17, 1973 12z
500mb vorticity
December 18-20, 1973 - 8.5 " at Toledo, 14 " at Defiance, 11.1 "
at
Fort Wayne, 11.2 " at Detroit, 11 " at Jackson, 9.3 " at
Lansing, 9.3
" at Flint, 5.5 " at Saginaw, 13.0 " at Indianapolis, 12.5 " at
South
Bend, 17.2 " at West Lafayette, 4.5 " at Evansville, 4.2 " at
Chicago
O'Hare, 9.8 " at Chicago Midway. Phasing northern upper low with
southern upper low in an sharp amplified trough, long straight
flow
south-southwest to north-northeast at jet level near the front
and
strongly deepening low - tracked from Arkansas to Tennessee to
South
Carolina/west Pennsylvania (two lows) and the East coastal plain
and
Maine/Canada.
Maps
December
18, 1973
snowfall contour (courtesy NCDC)
December
19, 1973
snowfall contour (courtesy NCDC)
December
20, 1973
snowfall contour (courtesy NCDC)
December
20, 1973
00z Surface temperature and Sea Level Pressure
December
20, 1973 00z
500mb vorticity
February 6, 1974 - 5.1 " at Toledo
Maps
February
5 Snowfall
contour (courtesy NCDC)
February
6 snowfall
contour (courtesy NCDC)
February
6, 1974
12z Surface temperature and Sea Level Pressure
February
6, 1974 12z
500mb vorticity
December 1, 1974 - the "Blizzard of
'74." 14" of snow fell at Toledo, 18.5" at Detroit made this
storm the largest
storm-total snowfall in Detroit and Toledo since 1900.
(Note: it is
debatable how much snow fell on January 26, 1978--it was too hard to
measure!)
Some of the snow was
wet and melting with high temperatures slightly above freezing
that
day. Detroit even reported thunder at 7:00PM on
December 1st! Also, at Detroit
the weather briefly switched to rain at the end of the
storm on December 2nd. There were
easterly gales and storm warnings on Lake Erie. This was a
cutoff upper low. A multi-contour 500mb low came in from the
middle of
the plains to Missouri to the Tennessee Valley. The surface low
formed in the mid-south,
and moved north from Alabama to Kentucky, and slowly moved across West
Virginia and Pennsylvania
. It eventually became a coastal low near New York City, with
horrendous rain and wind
at New York City. It even was snowing in Atlanta Georgia on the morning
of December 2nd.
This was on Thanksgiving weekend.
Certainly for this region it was the most significant snowfall
in a long time before 1974. Quotes from the Toledo Blade: Foruteen Inch snowfall cripples
Toledo area, thouseands are stranded, power lines downed.
Virtually
all area schools cancelled, including BGSU. Toledo's 3rd
heaviest
since 1900.
Maps
See loops
of this storm on the "Phasing Storms" page
November
30, 1974
snowfall contour (courtesy NCDC)
December
1, 1974
snowfall contour (courtesy NCDC)
December
2, 1974
snowfall contour (courtesy NCDC)
December
2, 1974
snow depth contour (courtesy NCDC)
Total Snowfall Nov. 27- Dec. 4
December
2, 1974
00z Surface temperature and Sea Level Pressure
December
2, 1974 00z
500mb vorticity
December 25-26, 1975 - 6 "
Maps
December
25, 1975
Snowfall contour (courtesy NCDC)
December
26, 1975
Snowfall contour (courtesy NCDC)
December
26, 1975
12z Surface temperature and Sea Level Pressure
December
26, 1975 12z
500mb vorticity
January 9-10 1977 - 9.1 " at Toledo and 5 " at Cleveland from a
powerfully phasing - inland tracking Louisiana to Ohio to
Vermont
low. 10 to 20 degrees during the storm. Schools shut down.
Quotes
from the Toledo Blade: Heavy
Drifting Snow Hits Area; Most Schools Close; Driving Perlious.
The
season's first heavy snowfall moved into the area overnight,
bolstered by windswept drifts that shut down virtually every
school
in Northwestern Ohio and Southeastern Michigan and made
traveling
generally treacherous. Snow depths in the outling areas
gnereally
varied from 4 to 6 " by 5AM. Hardin and Mercer counties had at
least
8 " on the ground.
Maps
January
9, 1977
Snowfall contour (courtesy NCDC)
January
10, 1977
Snowfall contour (courtesy NCDC)
January
10, 1977
12z Surface temperature and Sea Level Pressure
January
10, 1977 12z
500mb vorticity
January 28, 1977- Blizzard of 1977 - True blizzard conditions
prevailed for a couple of hours and a cold wave, fast moving
cold
front with some wind gusts to 60 mph with 2 to 4 " of snow, (3 "
at
Toledo Express Airport) blowing and drifting snow for many hours
or
really an entire day or two was the main concern. 4 " at
Cleveland.
Temperatures fell from 20 to -2 degrees in a half hour at
Toledo.
This was Buffalo, New York's blizzard of the century. Quotes
from the
Toledo Blade: By Friday night,
I-75
was closed virtually from Cincinnati to the Lucas County line.
The
Ohio Turnpike was closed from Fremont to Elyria/Lorain because
of
drifting and also between the Bryan and Stony Ridge Exits in the
eastbound direction only. Drifting conditions were less severe
in
southeast Michigan. Blizzard, subzero temperatures slow
Midwest,
East to a crawl.
Maps
January
28 Snowfall
contour (courtesy NCDC)
January
28, 1977 low
temperature (courtesy NCDC)
January
28, 1977 peak wind
gust (courtesy NCDC)
January
28, 1977
12z Surface temperature and Sea Level Pressure
January
29, 1977
00z Surface temperature and Sea Level Pressure
January
28, 1977 12z
500mb vorticity
January
29, 1977 00z
(approx. mid level cloud amount and wind)
March 17-18, 1977 - 7.8 " at Toledo
Maps
March
17 Snowfall
contour (Courtesy NCDC)
March
18 Snowfall
contour (courtesy NCDC)
March
18, 1977 00z
Surface temperature and Sea Level Pressure
March
18, 1977 00z
500mb vorticity
March
18, 1977 00z
(approx. mid level cloud amount and wind)
November 25-26, 1977 - 20 " at South Bend.
Maps
November
25
snowfall contour (courtesy NCDC)
November
26
snowfall contour (courtesy NCDC)
November
26, 1977
00z Surface temperature and Sea Level Pressure
November
26, 1977 00z
500mb vorticity
November
26, 1977 00z
(approx. mid level cloud amount and wind)
December 5-6, 1977 - 10 " at Toledo, 8 " at Findlay. Quote from
Toledo Blade: Wind Driven Snow
Closes Schools, Airport, Makes Driving Treacherous. Area's 10 "
of
snow takes toll in accidents, lost business. Gusts 22 to 42 mph. Visibility to 1200
feet at Airport.
Maps
December
4 Snowfall
contour (courtesy NCDC)
December
5 Snowfall
contour (courtesy NCDC)
December
6 Snowfall
contour (courtesy NCDC)
December
5, 1977
12z Surface temperature and Sea Level Pressure
December
5, 1977 12z
500mb vorticity
December
5, 1977 12z
(approx. mid level cloud amount and wind)
December 8-9, 1977 - 9 " at Toledo. The 6-day snowfall total was
20.3
" from December 5th to 10th.
Maps
December
8 Snowfall
contour (courtesy NCDC)
December
9 Snowfall
contour (courtesy NCDC)
December
9, 1977
00z Surface temperature and Sea Level Pressure
December
9, 1977 00z
500mb vorticity
December
9, 1977 00z
(approx. mid level cloud amount and wind)
January 17-18, 1978 - 9.9 " at Columbus, and 9.6 " at Akron,
this was
a major interior Northeast/Appalachian snowstorm.
Maps
January
16 snowfall
contour (courtesy NCDC)
January
17 snowfall
contour (courtesy NCDC)
January
18 snowfall
contour (courtesy NCDC)
January
18, 1978
00z Surface temperature and Sea Level Pressure
January
18, 1978 00z
500mb vorticity
January
18, 1978 00z
(approx. mid level cloud amount and wind)
January 19-21, 1978 - 11.5 " at Cleveland and 7.9 " at Columbus,
this
was a major interior Northeast snowstorm. Ranked #11 in terms of
the
NESIS.
Maps
January
19 snowfall
contour (courtesy NCDC)
January
20 snowfall
contour (courtesy NCDC)
January
21 snowfall
contour (courtesy NCDC)
January
20, 1978
12z Surface temperature and Sea Level Pressure
January
20, 1978 12z
500mb vorticity
January
20, 1978 12z
(approx. mid level cloud amount and wind)
January 26-27, 1978 - The Blizzard of 1978. This was one of the greatest storms of
the century for the Great Lakes and Ohio Valley. There were severe wind conditions with
heavy snow for many hours. There was 12" of snow at Toledo Express Airport. There was 22" of snow at Saginaw Michigan.
The Toledo and NW Ohio area had constant winds 45mph, wind gusts to 50 to 75mph. There were very large snow drifts, up to the tops of houses. My best estimate is
that the area in western Ohio and eastern Indiana saw 12 to 18" of snow, but hardly anybody could accurately measure it.
There were some greater snow amounts in eastern Indiana and also western Michigan. Temperatures
dropped quickly from near freezing at 6 AM to 8 degrees late in
the
day on the 26th. On the 27th, the temperature only rose to 17
degrees. This system was one of the most remarkable dynamic storms ever to form over the continent. Two powerful upper level lows phased together in the Ohio Valley. One system might be called a "Manitoba Mauler," and the other was from the southern plains. The surface low from the "Mauler" weakened in intensity.
The surface low from the southern system moved from Mississippi to central Ohio, then into southern Ontario, near London and Sarnia, and finally to Ontario/Quebec. The surface low pressure intensified 40mb in 24 hours. Cleveland recorded its lowest barometer reading ever.
There was a very substantial "comma head" cloud band a truly cold multi-contour 500mb low. Quotes from Toledo Blade:
Area Paralyzed by
Blizzard, some drifts 10 feet high; winds gust up to 50mph.
Blizzard
all but shuts down Toledo Area. President declares snow
emergency for
Ohio. Winds gusting to 85mph, damage all over East and Midwest.
28.26" barometric pressure at SS J. Burton Ayers off Pelee
Island and
wind gusts to 97 knots. Fifth Army troops flying in to help dig
out
city, area. 30,000 residences without power.
Toledo
Blade, January 26, front page
Toledo
Blade, January 27, front page
Maps
January
24 snowfall
contour (courtesy NCDC)
January
25 snowfall
contour (courtesy NCDC)
January
26 snowfall
contour (courtesy NCDC)
January
27 snowfall
contour (courtesy NCDC)
January
28 snow
depth contour (courtesy NCDC)
January
28 snow
depth contour - smaller view(courtesy NCDC)
January
26 Low
(minimum) temperature (courtesy NCDC)
January
26 peak wind gust
(courtesy NCDC)
January
23 12z 500mb
vorticity and height
January
24 00z 500mb
vorticity and height
January
24 12z 500mb
vorticity and height
January
25 00z 500mb
vorticity and height
January
25 12z 500mb
vorticity and height
January
26 00z 500mb
vorticity and height
January
26 12z 500mb
vorticity and height
January
27 00z 500mb
vorticity and height
January
20 to 23 averaged 850mb temperature anomaly
January
24
averaged 850mb temperature anomaly
January
25
averaged 850mb temperature anomaly
January
25 00z
surface temperature and SLP
January
25 12z
surface temperature and SLP
January
25 18z
surface temperature and SLP
January
26 00z
surface temperature and SLP
January
26 06z
surface temperature and SLP
January
26 12z
surface temperature and SLP
January
27 00z
surface temperature and SLP
January
25 12z
Northern Hemisphere SLP
January
25 00z 850mb
temperature
January
25 12z 850mb
temperature
January
26 00z 850mb
temperature
January
26 12z 850mb
temperature
January
27 00z 850mb
temperature
January
27 00z 700mb
temperature
January
26, 1978 00z
(approx. mid level cloud amount and wind)
January
26, 1978 12z
(approx. mid level cloud amount and wind)
Jan 25th NWS Daily Weather Map
Jan 26th NWS Daily Weather Map
January 12-14, 1979 - Midwest Blizzard of 1979. 17.2 " at South
Bend
and a 15.9 " at Chicago
Maps
January
12 Snowfall
contour (courtesy NCDC)
January
13 Snowfall
contour (courtesy NCDC)
January
14 Snowfall
contour (courtesy NCDC)
January
14 Snow
depth contour (courtesy NCDC)
January
14, 1979
00z Surface temperature and Sea Level Pressure
January
14, 1979 00z
500mb vorticity
January
14, 1979 00z
(approx. mid level cloud amount and wind)
February 10, 1981 - 8 " at Toledo and 8.5 " at Detroit. This was
likely a snow to rain transition at Toledo and Detroit through
the
storm, although I am not sure. This was a strong upper level
system
and a strongly deepening surface low, I might go so far as to
call
the system a trough merger or phasing.
Maps
February
9 snowfall
contour (courtesy NCDC)
February
10
snowfall contour (courtesy NCDC)
February
11
snowfall contour (courtesy NCDC)
February
10 12z
Surface Temperature and Sea Level Pressure
February
10 12z 500mb
vorticity
February
10 12z
(approx. mid level cloud amount and wind)
January 31, 1982 - 8.5 " at Toledo, 11 " at Findlay, and 11 to
11.8 "
at Detroit, 11 " at Fort Wayne (Toledo's biggest snowstorm of
1982)
highest wind gust 45mph at Toledo. Toledo Express airport was
closed
for 20 hours for snow removal. "Northwest
Ohio and Southeast Michigan
today were digging out after the area's worst snowstorm since
the
Blizzard of 78" - Toledo Blade. The temperature only
fell
from 20 at 1pm Sunday to 8 at 8am Monday.
Maps
January
30 snowfall
contour (courtesy NCDC)
January
31 snowfall
contour (courtesy NCDC)
January
31 12z
Surface Temperature and Sea Level Pressure
January
31 12z 500mb
vorticity
January
31 12z
(approx. mid level cloud amount and wind)
February 2-3, 1982 - 6.5 " at Toledo, 6.7 " at Fort Wayne.
Maps
February
2 snowfall
contour (courtesy NCDC)
February
3 snowfall
contour (courtesy NCDC)
February
4 snowfall
contour (courtesy NCDC)
February
3 00z
Surface Temperature and Sea Level Pressure
February
3 00z 500mb
vorticity
February
3 00z
(approx. mid level cloud amount and wind)
April 5-6, 1982 - Blizzard of '82 (I'm not sure if it was true
blizzard conditions at Toledo, but the winds were in the range
of
35mph). Northeasterly gales, 7.6 ". Highest wind gust 39mph.
Some
places had drifts 3 to 5 feet. It became a bomb cyclone offshore
from
New York. 300 people living near the shore of Lake Erie were
evacuated because of high water and waves. "Northeasterly winds
gusting to 42 mph boosted the level of Maumee Bay to 88 " (is
this
correct) above the average by 9:30 PM" - Toledo Blade. Port
Clinton
had waves as high as 8 feet. Thunder and lightning were
reported. The
temperature only dropped from 32 at 1pm Monday to 19 at 3am
Tuesday.
Quote from Toledo Blade: I-75
Was
Blizzard Survival Test. In April, it's no joke to be stranded by
snow. Toledo, Area Pummeled by Storm Packing High Wind, 7 " of
Snow.
Roads, Schools Closed, 300 Near Lake Evacuated.
Maps
April
4 snowfall
contour (courtesy NCDC)
April
5 snowfall
contour (courtesy NCDC)
April
6 snowfall
contour (courtesy NCDC)
April
6 00z
Surface Temperature and Sea Level Pressure
April
6 00z 500mb
vorticity
April
6 00z (approx.
mid level cloud amount and wind)
February 27-29, 1984 "Leap day snowstorm" honorable mention 4 "
Toledo, 6 " at Detroit. good 6-12 " of snow for most of Ohio,
Cincinnati, Columbus, and Cleveland. The low came from
Mississippi
and Alabama to eastern Kentucky to Pennsylvania. A really good
comma
head and multi-contour 500mb low. Quotes from Toledo Blade: Celeste Declares Statewide Emergency to
Battle Snow. Snow emergencies decleared in a number of area
counties.
Maps
February
26
snowfall contour (courtesy NCDC)
February
27
snowfall contour (courtesy NCDC)
February
28
snowfall contour (courtesy NCDC)
February
29
snowfall contour (courtesy NCDC)
February
28 12z
Surface Temperature and Sea Level Pressure
February
28 12z 500mb
vorticity
February
28 12z
(approx. mid level cloud amount and wind)
March 4, 1985 - 5.5" at Detroit.
Maps
March
4 snowfall
contour (courtesy NCDC)
November 27-28, 1985 - 2.4 " on Thanksgiving Day.
Maps
November
27
snowfall contour (courtesy NCDC)
November
28
snowfall contour (courtesy NCDC)
November
28 00z
Surface Temperature and Sea Level Pressure
November
28 00z 500mb
vorticity
November
28 00z
(approx. mid level cloud amount and wind)
January 18-19, 1987 - 8 " at Toledo
Maps
January
18 snowfall
contour (courtesy NCDC)
January
19 snowfall
contour (courtesy NCDC)
January
19 00z
Surface Temperature and Sea Level Pressure
January
19 00z 500mb
vorticity
January
19 00z
(approx. mid level cloud amount and wind)
March 30-31, 1987 - a 24-hour snowfall record 16.2 " in
Cleveland.
According to the Indianapolis NWS Office, up to 9 " fell along
the
Ohio River in southern Indiana.
Maps
March
30 snowfall
contour (courtesy NCDC)
March
31 snowfall
contour (courtesy NCDC)
March
31 00z
Surface Temperature and Sea Level Pressure
March
31 00z
500mb vorticity
March
31 00z (approx.
mid level cloud amount and wind)
Louisville
NWS training documents - see the PDF version of "Synoptic
Patterns
Associated with Heavy Snowfall Events in Kentucky and Southern
Indiana" on this page
April 4, 1987 cutoff upper low gets a lot of snow in Akron and
Columbus. 12.3 " fell at Columbus and 20.6 at Akron
Maps
April
3 snowfall
contour (courtesy NCDC)
April
4 snowfall
contour (courtesy NCDC)
April
5 snowfall
contour (courtesy NCDC)
April
4 12z
Surface Temperature and Sea Level Pressure
April
4 12z 500mb
vorticity
April
4 12z (approx.
mid level cloud amount and wind)
January 24-26, 1988 - 7 " at Toledo.
Maps
January
24 snowfall
contour (courtesy NCDC)
January
25 snowfall
contour (courtesy NCDC)
January
26 snowfall
contour (courtesy NCDC)
January
26 00z
Surface Temperature and Sea Level Pressure
January
26 00z 500mb
vorticity
January
26 00z
(approx. mid level cloud amount and wind)
February 3-4, 1988 - 6.2" at Toledo.
Maps
February
3 snowfall
contour (courtesy NCDC)
February
4 snowfall
contour (courtesy NCDC)
February
4 00z
Surface Temperature and Sea Level Pressure
February
4 00z 500mb
vorticity
February
4 00z
(approx. mid level cloud amount and wind)
February 10-12, 1988 - 6.5 " at Toledo.
Maps
February
10
snowfall contour (courtesy NCDC)
February
11
snowfall contour (courtesy NCDC)
February
12
snowfall contour (courtesy NCDC)
February
11 00z
Surface Temperature and Sea Level Pressure
February
11 00z 500mb
vorticity
February
11 00z
(approx. mid level cloud amount and wind)
October 19, 1989 - record October snowfall at several cities.
Maps
October
19 snowfall
contour (courtesy NCDC)
October
19 12z
Surface Temperature and Sea Level Pressure
October
19 12z 500mb
vorticity
October
19 12z
(approx. mid level cloud amount and wind)
January 14, 1992 7" at Toledo and - 11.1 to
12.7" at Detroit. Thundersnow at a rain-snow changeover at
Toledo.
Toledo Express Airport reported a high of 43 (this is probably
before
midnight on the 13th), low of 19, rain, snow, thunder, and fog
on
this day, a maximum wind gust to 36mph, average wind 22mph 0.87 "
of
precip total, and 6.7 " of snow. The temperature dropped to the
20's
by morning with the snow falling in the night an morning hours,
and
20-25mph winds in the afternoon made for some drifting. Track
near
Mississippi to eastern Ohio to northern New England - a bomb
cyclone
that went from 1004mb to 976mb in one day and involved a type of
phasing of two upper level lows.
Maps
January
13 snowfall
contour (courtesy NCDC)
January
14 snowfall
contour (courtesy NCDC)
January
15 snowfall
contour (courtesy NCDC)
January
14 00z 500mb
vorticity
January
14 00z
SLP and Surface Temperature
January
14 00z 300mb
speed
January
14 00z 850mb
speed
January
14 00z
850mb speed and 300mb speed
January
14 00z
(approx. mid level cloud amount and wind)
January
14 12z 500mb
vorticity
January
14 12z
SLP and Surface Temperature
January
14 12z 300mb
speed
January
14 12z 850mb
speed
January
14 12z
850mb speed and 300mb speed
January
14 12z
(approx. mid level cloud amount and wind)
March 21-22, 1992 - 6" at Toledo.
Maps
March
21 snowfall
contour (courtesy NCDC)
March
22 snowfall
contour (courtesy NCDC)
March
22 00z 500mb
vorticity
March
22 00z SLP
and Surface Temperature
March
22 00z 300mb
speed
March
22 00z 850mb
speed
March
22 14 00z
850mb speed and 300mb speed
March
22 00z (approx.
mid level cloud amount and wind)
March
22 12z 500mb
vorticity
March
22 12z SLP
and Surface Temperature
March
22 12z 300mb
speed
March
22 12z 850mb
speed
March
22 14 12z
850mb speed and 300mb speed
March
22 12z (approx.
mid level cloud amount and wind)
March 4, 1993 - "Surprise Snowstorm" 6 to 9" (9.4" at Toledo
Express
Airport) of wet snow with temperatures near and above freezing. I
got
out of school early at 1:00 due to the snow falling heavily by
noon
or 1:00, maybe up to 3 " per hour by 3:00. There were some
similarities to the November 25, 1950 storm track in the sense
that
it was a surface low at Virginia with an upper low over the
Tennessee
area, although it was certainly not as severe and not as cold -
it
was a rainstorm for many cities. (cutoff upper low)
Maps
March
4 snowfall
contour (courtesy NCDC)
March
5 snowfall
contour (courtesy NCDC)
March
4 12z
Surface Temperature and Sea Level Pressure
March
4 12z 500mb
vorticity
March 10-11, 1993 - 5.1" at Toledo. Set-up for the Superstorm.
Even
though Toledo got pretty much missed by the Superstorm, (see
next
entry) March 1993 rocked!
Maps
March
10 snowfall
contour (courtesy NCDC)
March
11 snowfall
contour (courtesy NCDC)
March
10 12z
Surface Temperature and Sea Level Pressure
March
10 12z 500mb
vorticity
March 13, 1993 - 8.5" of snow at Cleveland for the Superstorm of
1993. This was a blizzard of record snow amounts and very strong
winds for the Appalachians and East Coast, and even in extreme
eastern Ohio, there was 2-3 feet of snow. Ranked #1 in terms of
the
NESIS
Maps
March
12 snowfall
contour (courtesy NCDC)
March
13 snowfall
contour (courtesy NCDC)
March
14 snowfall
contour (courtesy NCDC)
March
13 12z 500mb
vorticity
March
13 12z SLP
and Surface Temperature
March
13 12z 300mb
speed
March
13 12z 850mb
speed
March
13 12z 850mb
speed and 300mb speed
Other Web Pages
Blizzard of
93
March
1993 superstorm
Surface
Images of March 1993 storm of the century
Schultz
and Steenburgh (1999) paper on Superstorm 93
Louisville
NWS Office web page on this storm
January 3-5, 1994 - 6" at Zaneville OH, southeast Ohio
snowstorm, interior Northeast snowstorm
Maps
January
4 12z
Surface Temperature and Sea Level Pressure
January
4 12z 500mb
vorticity
January 5-6, 1994 - 5.9" at Toledo, 10.1" at Detroit, 4.8" at
Flint, 4.5" at Cleveland, but Findlay got only 1 inch of snow
with freezing rain/rain This low moved from Oklahoma to
Kentucky/Ohio and weakened with a somewhat zonal flow with
arctic
surface high to the north, but reintensified offshore from New
York.
Maps
January
5 snowfall
contour (courtesy NCDC)
January
6 snowfall
contour (courtesy NCDC)
January
6 12z
Surface Temperature and Sea Level Pressure
January
6 12z 500mb
vorticity
January 16-17, 1994 - honorable mention - 3.5" at Toledo.
Extreme cold hit the region (-17F)
immediately after this storm. This was a serious snowstorm in
the
southern half of Ohio and Ohio River valley area. This was not
really
a standard type of storm development either. Historically cold
and
snowy month for southeast Ohio--by January 20th, Zanesville OH
had been at -25 degrees and had 11 inches of snow on the ground.
Maps
January
16 snowfall
contour (courtesy NCDC)
January
17 snowfall
contour (courtesy NCDC)
January
17 00z
Surface Temperature and Sea Level Pressure
January
17 00z 500mb
vorticity
Louisville
NWS Office web page on this storm
Louisville
NWS research paper on this storm
February 25, 1994 - 6" at Toledo, after a couple of previous
days,
the 22nd and 23rd, with a 5" snowfall total. The low tracked
from
Oklahoma to Iowa/Missouri/Illinois, then north central Indiana,
then
Columbus, then the Pennsylvania/Maryland border.
Maps
February
25
snowfall contour (courtesy NCDC)
February
25 12z
Surface Temperature and Sea Level Pressure
February
25 12z 500mb
vorticity
April 6, 1994 5.5" of wet snow - this
storm may have spread snow from Oklahoma through Indiana too.
Maps
April
5 snowfall
contour (courtesy NCDC)
April
6 snowfall
contour (courtesy NCDC)
April
6 12z
Surface Temperature and Sea Level Pressure
April
6 12z 500mb
vorticity
January 20-22, 1995 - 7.9" of snow fell in Toledo over 3 days.
This
was a southern stream closed upper low that featured some strong
dynamics on January 19 as it really hit the northeast Missouri
to
southern Wisconsin area with a lot snow on the 19th. A few
inches of
snow at several Ohio cities over a two or three day time frame.
There
was over 2.0" of total precipitation (snow, rain, freezing rain,
sleet) fell at Toledo over 3 days; some of this storm must have
been
rain or freezing rain.
Maps
January
19 snowfall
contour (courtesy NCDC)
January
20 snowfall
contour (courtesy NCDC)
January
21 snowfall
contour (courtesy NCDC)
January
22 snowfall
contour (courtesy NCDC)
January
20 12z
Surface Temperature and Sea Level Pressure
January
20 12z 500mb
vorticity
December 19-20, 1995 - 13 " of snow at Cleveland and 11" at
Mansfield 4" fell at Findlay, 12" at Youngstown, 5" at Dayton.
This system developed with a strong Greenland block in place.
Moderate Northeast snowstorm
Maps
December
19
snowfall contour (courtesy NCDC)
December
20
snowfall contour (courtesy NCDC)
December
18 23Z US Radar
(courtesy NCDC)
December
19 23Z US Radar
(courtesy NCDC)
December
19 12z
Surface Temperature and Sea Level Pressure
December
19 12z 500mb
vorticity
January 7, 1996 - Blizzard of 1996. This storm gets honorable
mention
for significant snowfall at Cincinnati (14") and Columbus (9")
and
Dayton (8") and Zanesville (7.1") as well as southeast Ohio. The
Northeast and Mid-Atlantic really got a big snowstorm. Although
it
didn't snow at Toledo from this storm, some amounts of 3-10" or
more
may have fallen in the Upper Sandusky, Kenton, and Bellefontaine
areas. I'm not sure. It produced a large area of snow, ice, and
rain
around the US. (Note: This was in the middle of a several
snowfalls
in Ohio in general within the first two weeks of January 1996.)
Synoptic picture: This was just plain a really strong upper low
in
the middle of the country coming into a strongly confluent flow
in
the eastern US and Canada. As you can see in the SLP/temperature
chart, the low was in Alabama or the Florida Panhandle with a
weak
low in eastern Tennessee, and there was a strong high to the
north,
northwest, and northeast of the low, with very cold surface
temperatures up north. Later on - January 7 to January 8, this
storm
developed into a bomb cyclone offshore from New York City.
Ranked #2
in terms of the NESIS.
Maps
Ohio
Valley, Pennsylvania,
Washington Radar composite (8 time frames)
January
6 snowfall
contour (courtesy NCDC)
January
7 snowfall
contour (courtesy NCDC)
January
5 23Z US Radar
(courtesy NCDC)
January
6 23Z US Radar
(courtesy NCDC)
January
7 23Z US Radar
(courtesy NCDC)
January
7, 0315Z Satellite image
(NCDC/NWS)
January
6, 1745z Satellite image
(NCDC Historical GOES Browser)
January
7 00z
Surface Temperature and Sea Level Pressure
January
7 00z 500mb
vorticity
November 9-14, 1996
Veterans
Day Lake Effect Snowstorm: November 9-14, 1996 in the Great
Lakes
January 2-3 1999 - Midwest Blizzard of 1999. This is a storm
with one
of the largest coverage areas (most square miles) of the Midwest
where 12 or more inches of snow fell during the storm,
approximately from
Detroit to Chicago, Milwaukee, and Chicago to the Quad Cities.
Areas farther south and east in Ohio
had 4" and then it changed to rain. Larger amounts of snow were
north and
west of Toledo . An area from Detroit to Chicago got around 15".
Snowfall at Milwaukee was even higher than 15". The
low pressure track was from around Louisiana to Indiana,
Michigan,
and Ontario.
This was my own personal favorite, even though it was a bit of a mess
around Toledo. It sleeted and there was a small amount of freezing rain
and rain after getting over 8", possibly 9" at my house. Possibly up to
12" of snow fell near the Michigan border. Winds of 20 mph made for
some drifting. 8" of snow was reported at Toledo Express Airport. Even
Detroit had a short changeover to rain.
The temperature rose from 14 to 32 degrees during the middle of
the snowstorm and then fell to 10 degrees on the January 3rd. There was
a wind gust of 37 knots from the WSW after the cold front.
Interestingly, this did not cause further drifting because the snow was
glazed over by the time the cold front came through. On January 10,
1999, one week later, Toledo had a low of -6 degrees, the coldest
temperature of that very changeable winter. In early December 1998, the
50-60 degree temperature range was relatively normal in Ohio!
I drove southwards on I-75 after the roads were cleared, and Findlay
Ohio was covered with thick ice.
The pre-storm synoptic setup was: 1. an area of strong confluence at
500mb and an arctic high pressure to the north, northwest, and northeast
of the low. 2. A strong low/ polar vortex at 500mb moved at a moderate
speed through southern Quebec. This is like the pre-storm environments
of some East Coast storms (notably January 7, 1996). Although the 500mb
confluence was farther west than it is for East Coast storms. Of course
the entire area of interest was west of the East Coast. The strong upper
low near Newfoundland (50/50 low) was present while the storm was
taking place in the Midwest. You can see phasing and deepening of the
two distinct upper low systems near Iowa on the 500mb loop. A strong
southerly low-level wind helped to transport moisture into the storm.
This is one of a few storms in history that went west of Toledo/Detroit
and delivered 8-12+" in the area.
Maps
Loop
of January 1 18Z
to January 3 0915z US Radar (courtesy NCDC)
January 2
1545Z satellite
Image (NCDC/NWS)
January
2, 12z Satellite image
(NCDC Historical GOES Browser)
January
3, 00z Satellite image
(NCDC Historical GOES Browser)
January
2 12z 500mb
vorticity
January
2 12z
SLP and Surface Temperature
January
2 12z 300mb
speed
January
2 12z 850mb
speed
January
2 12z 850mb
speed and 300mb speed
470KB
Loop of January 2 12z to January 3, 15z Midwest Surface Plot
230KB
Loop of January 2 12z to January 3, 06z Northeast Surface Plot
1.9MB
Loop of January 1 15z to January 3, 11z Midwest Weather
Depiction
500mb
loop of this storm
Snowfall
Totals January 2 to 4, 1999
March 9-10, 1999- 7", a Colorado low tracked to the Midwest and
Ohio
Valley and Mid-Atlantic. This system developed with a very
confluent
flow aloft from New England to 35N 60W in the ocean, and a
blocking
high was near Newfoundland.
March 8-10 Snowfall totals from NWS offices' preliminary climate
reports Toledo 7.3", Cleveland 3.1", Mansfield 5.3", Akron 5.2",
Youngstown 3.5", Erie 0.5", Detroit 3.5", Flint 1.2", Columbus
7.5",
Cincinnati 5.2", Dayton 7.8", Indianapolis 5.2", South Bend
5.9",
Fort Wayne 7.1", Grand Rapids 5.1", Lansing 4.5", Muskegon 2.9",
Davenport 9.4", Chicago O'Hare 10.0", Rockford 6.8", Milwaukee
7.7",
Madison 5.8", Pittsburgh 6.5", St. Louis 0.5".
Maps
March
9 09Z US Radar
(courtesy NCDC)
March
9 12Z US Radar
(courtesy NCDC)
800KB
Loop of March 9 00z to March 9 17z Midwest Weather Depiction
Loop
of March 9 18z to March 10 03z Northeast Weather Depiction
Loop
of March 10 04z to 06z Mid-Atlantic Weather Depiction
March
9 12z
Surface Temperature and Sea Level Pressure
March
9 12z 500mb
vorticity
December 11-12, 2000 - 6-14" in Southeast Michigan, with gusty
winds
near the end, especially heavy snow conditions at Flint. Toledo
and
Fort Wayne got a little snow, rain, and freezing rain. Flint got
an
amazing total of 18.4 " in four days. Saginaw got 9 ". Detroit
Metro
Airport got 6.1" due to mixing with freezing rain. Ann Arbor got
13".
December 11-12 (including December 10 for IL, IA, and WI) Snowfall
from NWS forecast offices' preliminary climate data: Toledo
1.7",
Cleveland 0.4", Mansfield 0.3", Detroit 6.1", Flint 14.0",
,Saginaw
9.8", South Bend 12.0", Fort Wayne 0.2" , Grand Rapids 15.2",
Lansing
15.0", Muskegon 13.0", Davenport 8.7", Dubuque 9.0", Chicago
O'Hare
9.6", Rockford 9.3", Milwaukee 14.1", Madison 5.8", Des Moines
8.5".
NWS
Public
Information Statements on December 12 regarding snowfall
Maps
December
11 12z 500mb
vorticity
December
11 12z
SLP and Surface Temperature
December
11 12z 300mb
speed
December
11 12z 850mb
speed
December
11 12z
850mb speed and 300mb speed
December
11 18z
SLP and Surface Temperature
Loop
of December 11
03z to December 12 09z US radar (courtesy NCDC)
December
11 23z DTX nexrad
image
December
11 00z IR Satellite
(NCDC Historical GOES Browser)
December
11 12z IR Satellite
(NCDC Historical GOES Browser)
December
12 00z IR Satellite
(NCDC Historical GOES Browser)
770KB
Loop of December 11 12z to December 12 05z Midwest Weather
Depiction
Detroit
Metro Observations
during this storm
Flint
Observations during
this storm
Toledo
Observations during
this storm
Lansing
Observations during
this storm
Ann
Arbor Observations
during this storm
Ypsilanti-Detroit
Willow Run Observations during this storm
Adrian
Observations during
this storm
Monroe
Observations during
this storm
Pontiac
Observations during
this storm
Jackson
Observations during
this storm
Howell
Observations during
this storm
December 13-14, 2000. Snowstorm for several cities and some
amount of
ice in Ohio, Indiana, Kentucky, Illinois, and Missouri. Snowfall
totals from NWS forecast offices' preliminary Monthly climate
data:
Toledo 6.3", Mansfield 4.5", Akron 1.8", Cleveland 4.6",
Columbus
1.2" snow, may have had freezing rain, Cincinnati 1.8" snow, may
have
had freezing rain, Dayton 1.5" snow, may have had freezing rain,
Detroit 4.9", Lansing 3.6", Grand Rapids 5.5", Muskegon 4.0",
Fort
Wayne 4.5", South bend 4.2", Indianapolis 5.7" of snow, may have
had
freezing rain, Chicago O'Hare 6.0", Rockford 3.9", Davenport
1.4",
Milwaukee 3.8", Madison 1.4", Springfield MO 13.7", St. Louis
7.7",
Louisville 1.5", may have had freezing rain, Paducah 3.6", had
freezing rain, Evansville 3.6", may have had freezing rain.
Commentary on December 2000
This was only two days after southern Michigan got 6 to 14".
After
these 4 days, snow depths in southeast Michigan were pretty much
15 "
or better. Detroit Metro Airport had a depth of 11 " on December
14th. On December 30th, Toledo Express Airport had a depth of
14". I
think the snow depth at Toledo was about 13-16" by December
21st,
which is the best I have ever seen in Toledo. This may have been
the
highest snow depth in Toledo since 1982 or 1978. This was a very
cold
month and the snowpack built up, in contrast to the winter of
1999-2000 and also in contrast to almost all of the winter
1998-1999
except for January 1st to 20th.
Maps
December
13 12z
Surface Temperature and Sea Level Pressure
December
13 12z 500mb
vorticity
December
13 12z 300mb
wind speed
December
14 00z
Surface Temperature and Sea Level Pressure
December
14 00z 500mb
vorticity
December
14 00z 300mb
wind speed
December
13 00z 850mb
wind speed
December
13 06z 850mb
wind speed
December
13 12z 850mb
wind speed
December
13 18z 850mb
wind speed
December
14 00z 850mb
wind speed
Loop
of December 13
12z to December 14 03z US radar (courtesy NCDC)
December
13 00z IR satellite
(courtesy NCDC Historical GOES Browser)
December
13 12z IR satellite
(courtesy NCDC Historical GOES Browser)
December
14 00z IR satellite
(courtesy NCDC Historical GOES Browser)
Toledo
Observations
during this storm
270KB
Loop of December 13 17z to 22z Midwest Weather Depiction
Other web page
December
2000 record snow
January 30, - February 1, 2002 - Honorable mention for 7.6" at
Detroit and 9.6" at Flint, up to 9.5" near and in Detroit, and
more
than 4" across much of the southern section of Michigan in
general.
(See Ice Storm Section)
Maps
January
31 12z 500mb
vorticity
January
31 12z
SLP and Surface Temperature
January
31 12z 300mb
speed
January
31 12z 850mb
speed
January
31 12z
850mb speed and 300mb speed
March 24-26, 2002 - "Toledo Special" snowstorm,
9" in two batches of snow, 12" in nearby Monroe County,
Michigan.
This ended off a relatively snowless winter.
Maps
March
25 12z 500mb
vorticity
March
25 12z SLP
and Surface Temperature
March
25 12z 300mb
speed
March
25 12z 850mb
speed
March
25 12z 850mb
speed and 300mb speed
December 24-25, 2002 - Christmas snowstorm of 6 to 7" (7.1 " at
Toledo). This affected a large area of Illinois, Indiana, Ohio,
and
the Northeast. This southern stream low came from Texas and
Louisiana
to Kentucky and Ohio This became a bomb cyclone as it formed a
coastal low offshore from New York. A split jet and the southern
jet
disturbance from Arizona came toward jet confluence in the
Midwest.
Interior Northeast snowstorm caused over 2 feet of snow at Albany NY.
Maps
December
25 00z 500mb
vorticity
December
25 00z
SLP and Surface Temperature
December
25 00z 300mb
speed
December
25 00z 850mb
speed
December
25 00z
850mb speed and 300mb speed
December
24
snowfall (Courtesy NOHRSC)
December
25
snowfall (Courtesy NOHRSC)
January 2, 2003 - 5" at Toledo, interior Northeast snowstorm
Maps
January
2 12z 500mb
vorticity
January
2 12z
SLP and Surface Temperature
January
2 12z 300mb
speed
January
2 12z 850mb
speed
January
2 12z 850mb
speed and 300mb speed
January
2
snowfall (Courtesy NOHRSC)
February 17, 2003- "President's Day Storm 2" - Affected a huge
area
of the country with precipitation. About 3 to 5" of snow at
Toledo.
Northeasterly winds through the whole thing. 15.5" fell at
Columbus
making it the largest storm in Columbus history, and 10-16" in
southeast Ohio over the 14th-17th. Remarkably, the surface low
looked
generally pretty weak as it sank southeastward from Missouri to
Alabama at 1005mb, but it had a huge pressure gradient from high
to
low. The precipitation was over almost all states farther north
than
Alabama at that time! It was a super frontal zone and super
confluence zone with an southwesterly low-level jet and then
easterly
low-level jet that would not give up! This became a coastal low
on
the night of 16th/17th but the upper low and comma head actually
formed right over Ohio. The storm system came onshore at the San
Diego/Baja area and gave heavy rain to Los Angeles on either the
10th
or 12th. Ranked #3 in terms of the NESIS.
Maps
February
17 00z 500mb
vorticity
February
17 00z
SLP and Surface Temperature
February
17 00z 300mb
speed
February
17 00z 850mb
speed
February
17 00z
850mb speed and 300mb speed
February
14
snowfall (Courtesy NOHRSC)
February
15
snowfall (Courtesy NOHRSC)
February
16
snowfall (Courtesy NOHRSC)
February
17
snowfall (Courtesy NOHRSC)
The
Presidents Day Weekend Snowstorm of 2003
February 22-23, 2003 - "Windsor Canada Special" 5 to 8" (8.9" at
airport), 6 to 12 " north of Toledo in Monroe County, Michigan,
and
12" in far southern Ontario. Low track Texas to West Virginia to
Montreal. Partial phasing. Good frontogenesis and comma head
cloud
here. A mere 5-6 days after "President's Day Storm 2", this
caused
heavy downpours on the thick snow on the ground in the
Mid-Atlantic
and Northeast, causing a roof to collapse near Washington.
Maps
February
23 00z 500mb
vorticity
February
23 00z
SLP and Surface Temperature
February
23 00z 300mb
speed
February
23 00z 850mb
speed
February
23 00z
850mb speed and 300mb speed
February
22
snowfall (Courtesy NOHRSC)
February
23
snowfall (Courtesy NOHRSC)
February
24
snowfall (Courtesy NOHRSC)
December 22-23, 2004 - 7.8" of snow at Toledo on the night of
the
22nd and the morning of the 23rd, this was a very significant
snowstorm for areas south of Toledo from Findlay to Cincinnati
(12-16
" fell), east to Sandusky, 15.5" of snow and some freezing rain
fell
at Cleveland, also significant at Indianapolis and much of the
Ohio
River Valley west of Cincinnati, this storm also was a major ice
storm with some snow in Cincinnati and Columbus.
Maps
December
22 12z 500mb
vorticity
December
22 12z
00z SLP and Surface Temperature
December
22 12z 00z
300mb speed
December
22 12z 00z
850mb speed
December
22 12z 00z
850mb speed and 300mb speed
December
23 12z 500mb
vorticity
December
23 12z
00z SLP and Surface Temperature
December
23 12z 00z
300mb speed
December
23 12z 00z
850mb speed
December
23 12z 00z
850mb speed and 300mb speed
December
23 12z 500mb
vorticity
Loop
of December 22
12z to December 23 15z US Radar (courtesy NCDC)
December
21 to 23 snowfall (Courtesy NOHRSC)
December
24 snow
depth (Courtesy NOHRSC)
January 8, 2005 - Surprise snowstorm 5.5" at Toledo Express
Airport
with local reports of 7.5 to 8.5".
January
7
to 8 snowfall (Courtesy NOHRSC)
January
7 snow
depth (Courtesy NOHRSC)
January
9 snow
depth (Courtesy NOHRSC)
January 22-23, 2005 - Major snowstorm for the Midwest and
Northeast -
12 " reported at Toledo Express Airport with local reports of 7
to 10",
this was about a 10 to 12" snowfall for most of southern
Michigan's cities. The northern third of Ohio is where the snow
accumulations over 3" were.
Maps
January
22 06z US Radar
(courtesy NCDC)
January
22 09z US Radar
(courtesy NCDC)
January
22 12z US Radar
(courtesy NCDC)
January
22 15z US Radar
(courtesy NCDC)
January
22 18z US Radar
(courtesy NCDC)
January
22 21z US Radar
(courtesy NCDC)
January
21 to 23 snowfall (Courtesy NOHRSC)
January
24 snow
depth (Courtesy NOHRSC)
March 31-April 3, 2005 - 5 to 20" of wet snow between Cleveland,
Youngstown, Akron, Erie, and Buffalo. The hilly areas above 1000
feet
are generally the ones that got over a foot of snow. This was
not a
lake-effect snowstorm, amazingly!
April
3 snowfall
(Courtesy NOHRSC)
April
3 snow depth
(Courtesy NOHRSC)
April 23-24, 2005 - Late April Snowstorm in Michigan and
Northern
Ohio. About 4 to 5" of actual snow accumulated on the ground in
Toledo on April 24. What a storm! This was a pretty darn good
phasing/trough merger event, and the low pressure area hung
around in
southern Ontario for over a day (north and west of Toronto) -
the
sweet spot for eastern Michigan and Lake Huron.
April
22 to 25 snowfall (Courtesy NOHRSC)
December 8-9, 2005 - 9.2 " of snow at Toledo Express, 5.2 " in
my
backyard
Dec
8, 7:00PM US
Surface Analysis
Dec
8, 8:15PM IR
Satellite Image
Dec
8, 6:00PM
National Radar
Dec
8, 9:57PM
National Radar
48
hour
snowfall to December 10, courtesy NOHRSC
Dec
8, 7:00PM 500mb
Vorticity
Dec
8, 7:00PM 850mb
wind speed
February 12-15, 2007 - Major snowstorm for the Midwest and
Northeast
- 9.4" of snow reported at Toledo Express Airport with local
reports
of 8 to 12" over 3 days. 10.4" of snow at Detroit Metro Airport
over
3 days
February
12 to 15
snowfall (Courtesy NOHRSC)
December 15-18, 2007 - Major snowstorm for the Midwest and
Northeast - 6.3" of snow reported at Toledo Express Airport over
2
days. 9.0" of snow at Detroit Metro Airport over 2 days.
December
14 to 17
snowfall (Courtesy NOHRSC)
December 31, 2007 to January 1, 2008 - Major snowstorm for Port
Huron, Flint, Ann Arbor, and South Bend. Flint: 11.2" Detroit
Metro:
5.5" South Bend: 12.1" Lansing: 6.9"
December
31 to
January 1 snowfall (Courtesy NOHRSC)
Radar
at 5:00AM EST
January 1
February 25-26,2008 - Toledo 8.8" of snow
March 7-8,2008 - See Blizzards 2005 to Present for snow totals from Ohio
Ice storms are somewhat harder to research, due to the fact that
there is no "icefall" record in the daily weather information.
Information for Toledo unless otherwise stated
January 2-3 1947- ice storm Source: "Thunder in the Heartland"
January 29-30, 1947 -ice storm Source: "Thunder in the
Heartland"
January 1, 1948 - freezing rain with thunder, hail, fog, and
gale
force winds. Source: "Thunder in the Heartland"
January 26-27, 1967 - Toledo Blade quotes: "Rain-Snow-Sleet Storm Cripples Area; 2
Plants Closed by Power Loss." Nine Midwestern States lashed by snow,
sleet. Detroit itself escaped the brunt of the storm, but its
suburbs
were hard it. While giving over 12 " to a large portion
of the
Great Lakes, Detroit got only 4" and Toledo only 2", due to
rain,
freezing rain and sleet.
March 4, 1982 - high 40, low 9, with 0.9" of precipitation and
1.9"
of snow
January 24, 1982 - high 35, low 30, with 0.2" of precipitation
and
0.2 inch of snow.
January 29, 1987 - high 32, low 16 with 0.35" of precipitation
atnd
2.5 " of snow.
December 27, 1988, high 42, low 29, with 0.4" of precipitation
and no
snow.
January 6, 1989 - high 35, low 31, and 0.2" of precipitation on
each
of these days: January 5th, 6th, and 7th.
March 18, 1989 - high 34, low 25, 0.6" of precipitation,
thunder,
freezing rain, and snow.
January 20, 1990 - high 33, low 30, 0.4" of precipitation with
no
snow recorded.
February 2, 1990 - high 44, low 26, 0.58" of precipitation with
no
snow.
February 15, 1990 high 32, low 28, with 0.98" of precipitation
(mostly freezing rain) and 2.2" of snow. Toledo Blade: "Ice
Storm
Cuts Power, Shuts Schools" in Second News section.
December 22-23, 1990 on December 23 high 30, low 17, with 0.6
inch of
precipitation (mostly freezing rain) and with 3.9" of snow.
January 5, 1991 - high 33, low 11, with 0.15" of precipitation
and
0.8 inch of snow.
January 11, 1991 - high 35, low 29, with 0.5" of precipitation
and
0.7 inch of snow.
February 13, 1991 - high 35, low 23, 0.6" of precipitation
(mostly
freezing rain) with 0.1" of snow. Freezing rain reported at Fort
Wayne, Detroit, and Cleveland.
March 4, 1993- Ice might have occurred with this snow storm
January 27, 1994 - some freezing rain and some rain, 0.6" of
precipitation on this day, high 42, low 15.
March 27, 1995 - Ice storm at Bowling Green
April 10, 1995 - Ice storm. (?) High 43, low 32, 0.98" of
precipitation, no snow, but 0.1 inch on the 9th
December 12-13, 1995 - Ice storm, high 18 and 32, low 11 and 17 ,
0.42" of precipitation and 1.3" of snow, rain occurred.
March 13, 1997 - High 35 - low 30, 0.47" of precipitation and no
snow.
January 12-13, 1998 - Ice storm. High 40 and 33 , low 25 and 14,
rain
and snow occurred, 0.11" of precipitation and 0.2" of snow.
January 2, 1999- The snowstorm/blizzard of '99 caused signficant
freezing rain to fall at Findlay. There was sleet for at least a
couple of hours at Perrysburg, and also some light freezing rain
and
rain for a short while.
December 11, 2000 - Ice storm with significant snow storm to the
north
January 30-February 1, 2002 - Significant freezing rain on the
north
side of Toledo and just north of Toledo in Michigan. Strong wind
gusts after the storm caused more damage to trees and power
lines
that were covered in ice. This was a long 2-3 day "overrunning"
situation that had two waves of precipitation move along a
stationary
front and caused rain, snow, and ice from Kansas to New York.
The
front was to the south of Toledo so the wind was northeasterly
the
entire time. It eventually became a more classic low pressure
center
and gusty westerly winds followed.
March 13, 2003 - thunder, 1" of sleet and 0.25" of freezing rain
(my
estimation)
January 4, 2004 - some freezing rain with this snow storm
January 5-6, 2005 - Ice and Snow Storm - major ice accumulations
at
Findlay and Lima and areas south of Toledo, some freezing rain,
sleet, and 4" of snow at Toledo. The snow and rain began around
midnight on January 5.
December 9, 2007 - Ice Storm. 0.46" of freezing rain fell at
Toledo,
the high was 30 degrees.
References
"Thunder in the Heartland," by Thomas Schmidlin
"A Century Or So of Wood County Weather" by Lyle Rexford Fletcher
Toledo Public Library
NCEP/NCAR Reanalysis
NOAA North American Regional Reanalysis
Plymouth State Historical Surface/Upper/Satellite Maps
NOAA Physical Sciences Laboratory, Boulder
1. February 28 - March 1, 1900. 22".
2. December 1-2, 1974. 14"
3. January 13, 1910 , January 26-27, 1978, and January 22-23,
2005
tied at 12"
6. November 16, 1932. 11.5"
7. February 21, 1912. 11"
8. January 13-15, 1968. 10.3"
9. April 7-8, 1957 and December 5-6, 1977 tied at 10"
11. November 2-3, 1966. 9.5"
12. February 12-15, 2007. 9.4"
13. December 8-9, 2005. 9.2"
14. January 9-10, 1977. 9.1"
15. December 8-9, 1977, and March 4, 1993 tied at 9"
1. February 28 - March 1, 1900, 22".
2. December 1-2, 1974, 14"
3. January 5, 2014, 13", "Polar Vortex Blizzard"
4. January 13, 1910, 12"
4. January 26-27, 1978, The Great One, 12" (with 10 ft drifts)
4. January 1-2, 1999, unofficially 12" in north Toledo
4. January 22-23, 2005, 12" (I personally only measured only 9" near the Airport)
4. February 1-2, 2015, 12"
9. November 16, 1932, 11.5"
10. February 21, 1912, 11"
11. January 13-15, 1968, 10.3"
12. February 14-15, 2007, 10"
12. December 5-6, 1977, 10"
12. April 7-8, 1957, 10"
15. December 24-25, 1951, 9.9"
16. November 2-3, 1966, 9.6"
17. March 4, 1993, 9.4"
17. January 1-2, 2014, 9.4"
Snowstorms at Toledo Express
Airport
of 8 " or more since 1990
March 4, 1993, January 1-3, 1999, March 24-26, 2002, February
22-23,
2003, December 22-23, 2004, January 22-23, 2005, December 8-9,
2005, February 12-15, 2007, and February 25-26, 2008.
Toledo's top snow months were:
32.6" in January 1978
27.6" in January 2005
note: 27" at Bowling Green in January 1910
26.2" in January 1918
26.0" in December 2000
25.5" in December 1951
25.1" in February 1900
23.5" in December 1895
24.2" in December 1977
23.9" in December 1974
23.6" in February 2008
23.1" in January 1912
22.3" in January 1895
21.5" in December 2005
21.4" in February 1896
20.8" in February 1960
20.5" in January 1987
20.2" in January 1994
19.2" in January 1982
Toledo's snowiest winter - 1977-1978 with 74.9 "
Toledo's Top Winter Snowfall Amounts
1. 1977-1978 - 74.9"
2. 1981-1982 - 69.0"
3. 1895-1896 - 63.7"
4. 1966-1967 - 60.6"
5. 1969-1970 - 59.6"
6. 2007-2008 - 58.1"
7. 1993-1994 - 56.8"
8. 2002-2003 - 56.4"
9. 2004-2005 - 56.0"
10. 1976-1977 - 53.9"
11. 1911-1912 - 51.9"
12. 1951-1952 - 51.8"
13. 1959-1960 - 47.9"
14. 1975-1976 - 46.1"
15. 1950-1951 - 46.0"
note: Data on this table is since 1949, except for the 1895-1896
and
1911-1912 values.
The 6 Best/Worst Snowstorms at Toledo, in no particular order
January 1918
January 1978
November 1913
November 1950
December 1974
February-March 1900
Toledo: February 28 - March 1, 1900. 22".
Findlay: January 30-31, 1982 12.4"
Cleveland: November 9-11, 1913. 22". November 23-27, 1950.
20.9".
Columbus: President's Day 2003 (February 14-17). 15.5".
Columbus: March 7-8, 2008. 20.5"
Cincinnati: January 14, 1863. 20".
Akron: December 1-2, 1974. 24.".
Mansfield: January 13-15, 1968: 18.0".
Dayton: December 22-23, 2004. 16.4". previous record: January
26-27,
1978. 12.2 ".
Youngstown: November 23-27, 1950. 28.8".
Zanesville: January 13-15, 1968. 16.8".
Detroit: April 6, 1886. 24.5". More modern record: December 1-2,
1974. 19"
Ann Arbor - December 1-2 1974. 19.8"
Saginaw- January 26-27, 1967. 23.8". (Possibly January 16, 1871
30 ")
Flint- January 26-28, 1967. 22.7".
Lansing - January 26-27, 1967. 24".
Muskegon - January 25-27, 1978. 30.7".
Grand Rapids - January 25-27, 1978. 19"
Fort Wayne - March 10-11, 1964. 15.2".
Indianapolis - January 25-27, 1978. 15.2"
South Bend - November 25-27, 1977. 24.2". January 25-27, 1978
23.6"
Chicago - January 26-27 1967. 23".
Battle Creek - January 26-27, 1967. 28.6"
The purpose is to provide high quality information on historical storms
and provide links to weather information.
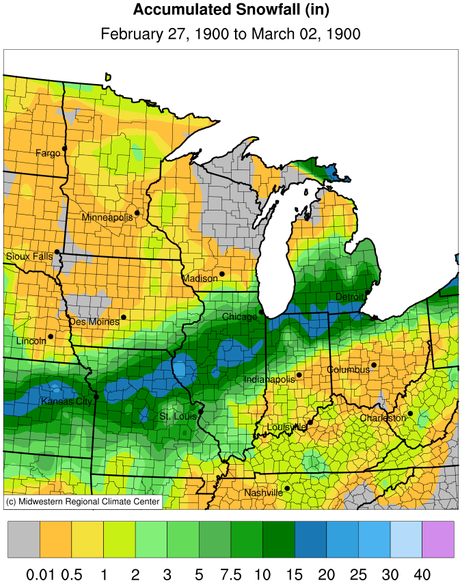
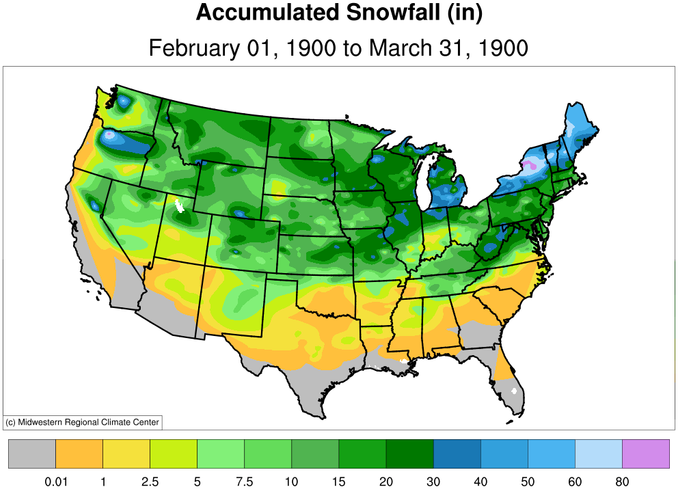
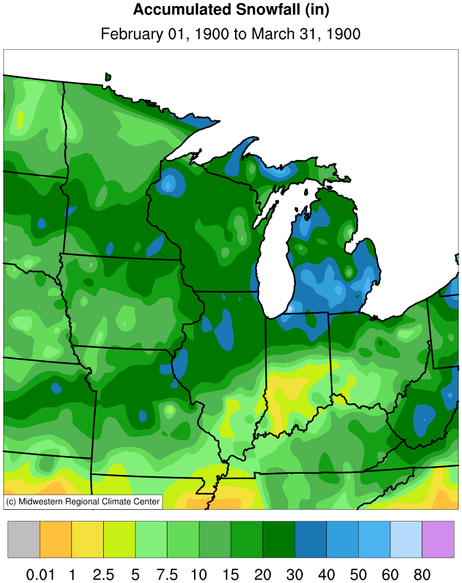
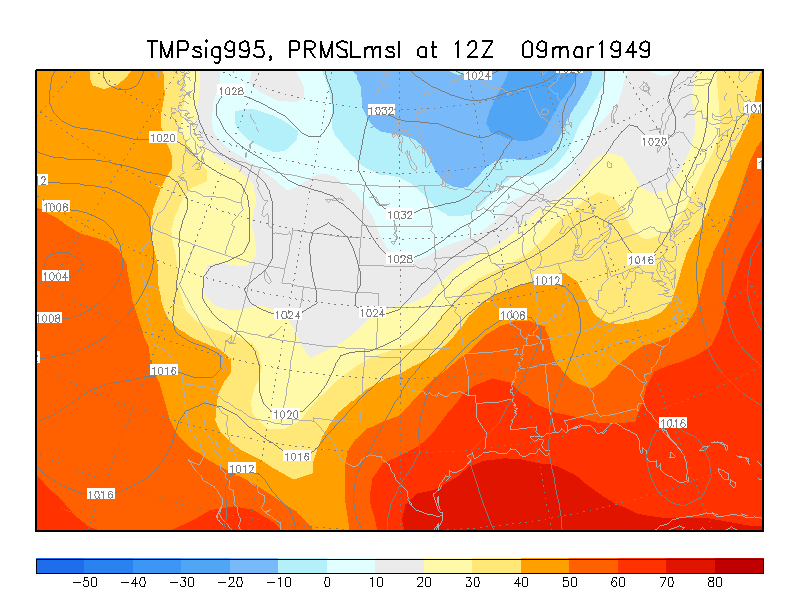
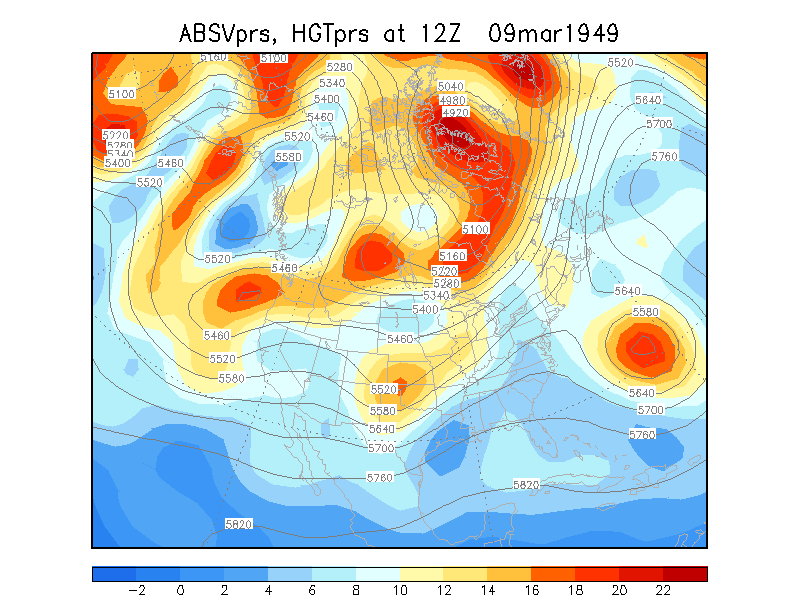
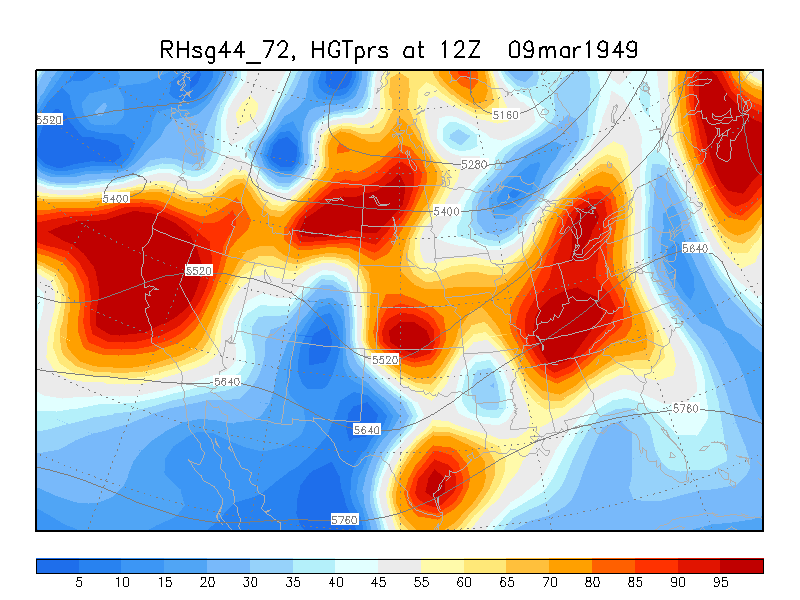
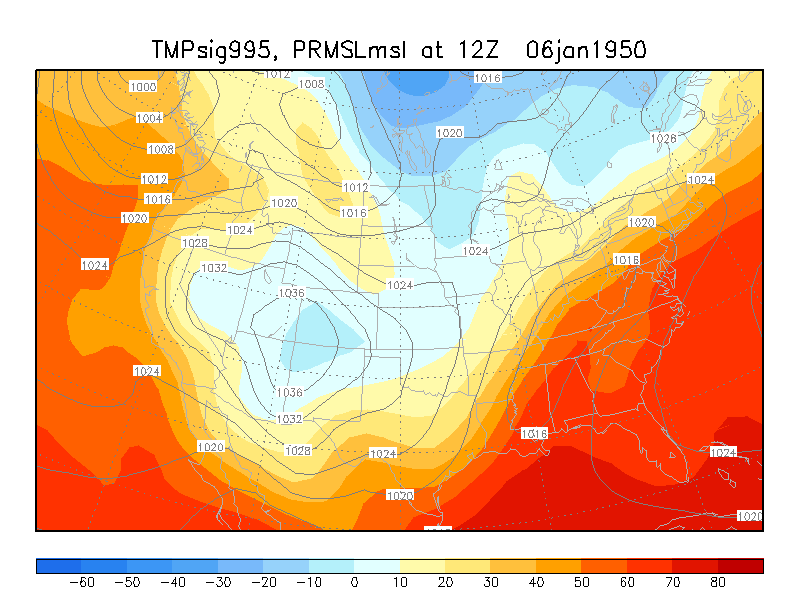
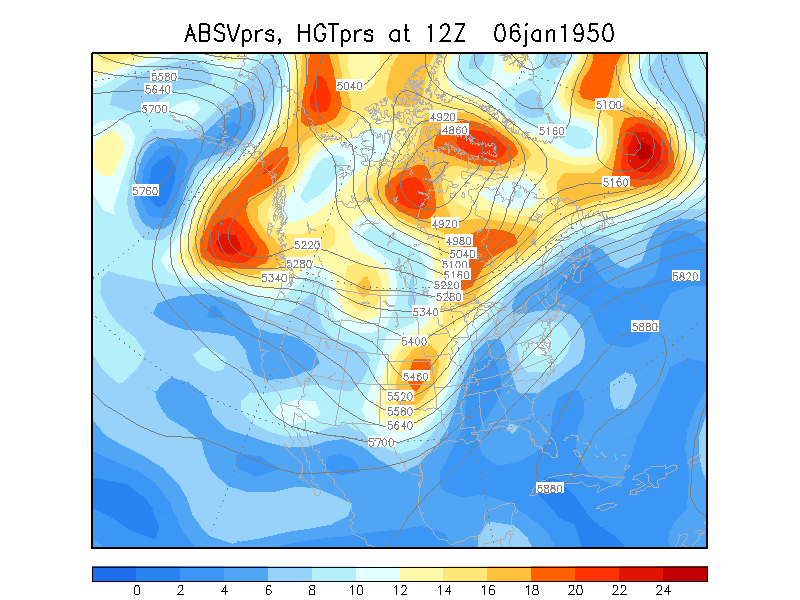
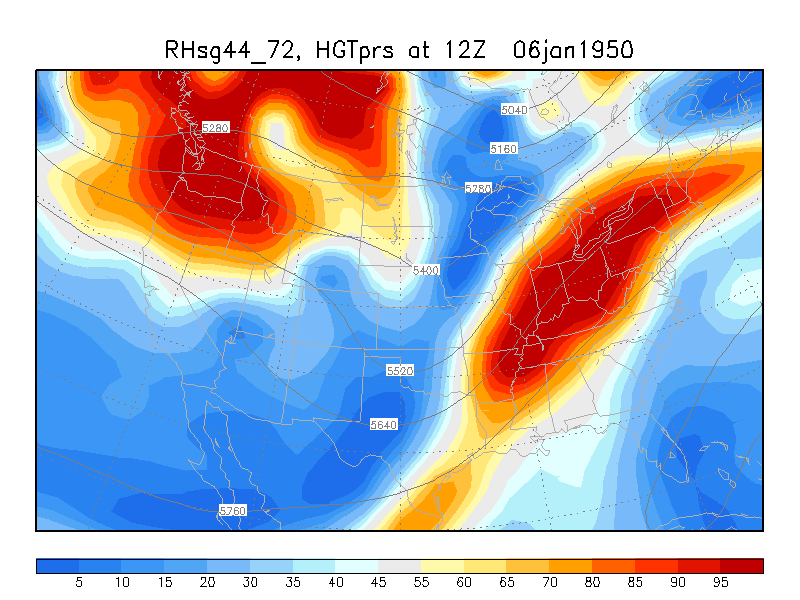
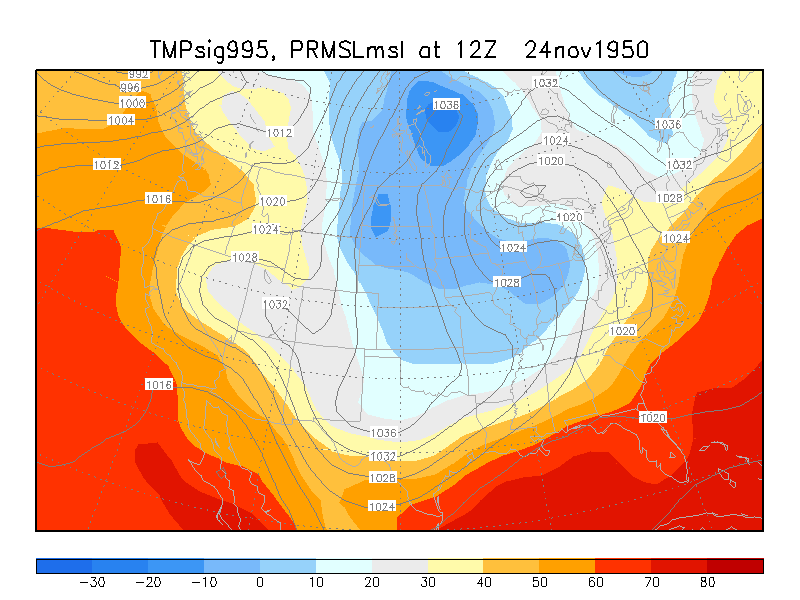
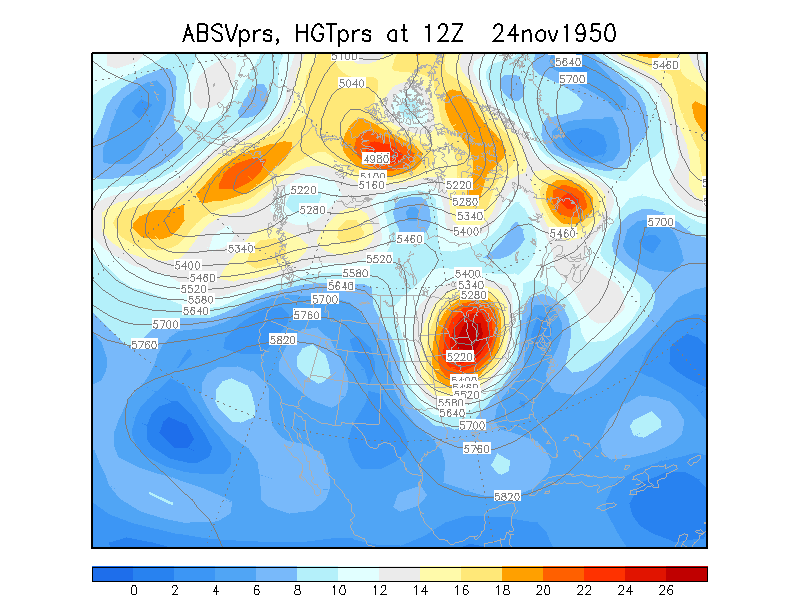
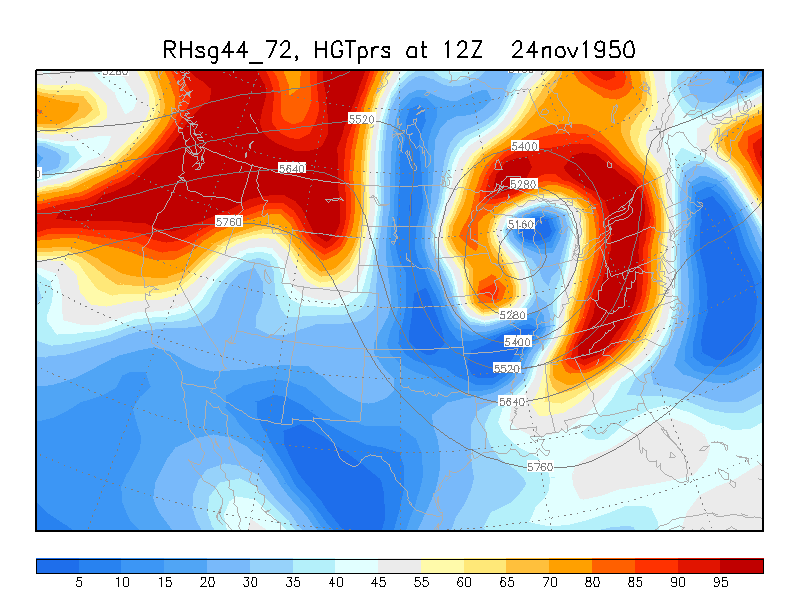
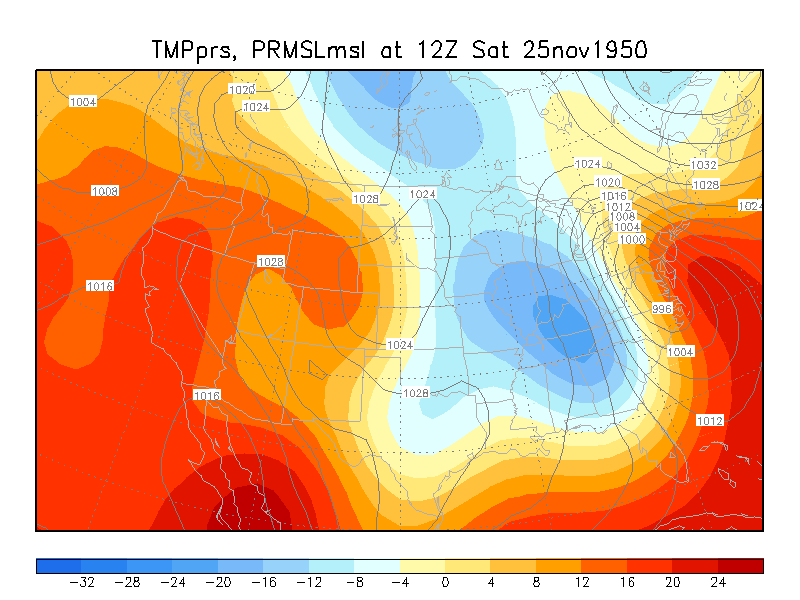
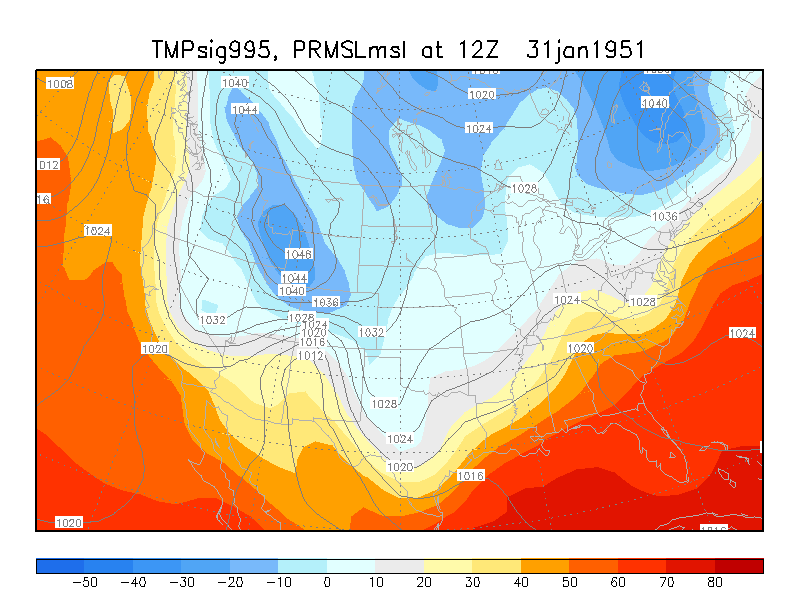
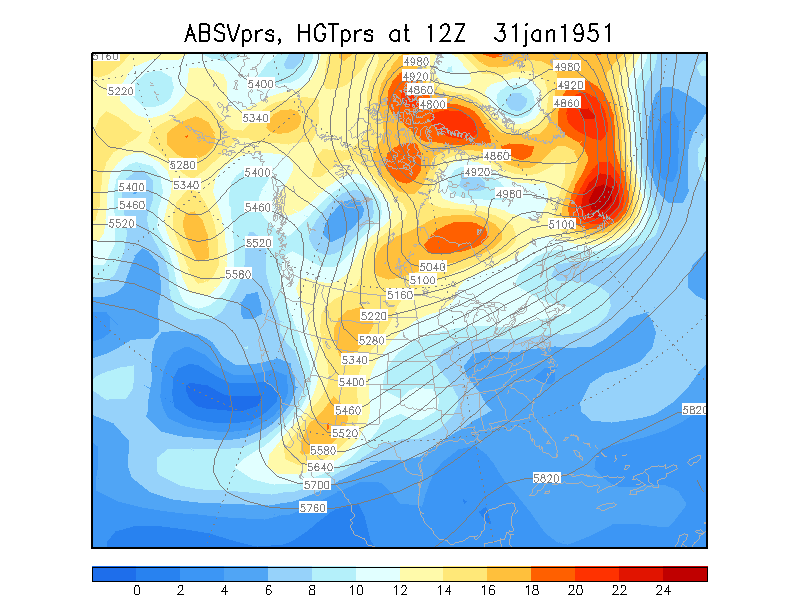
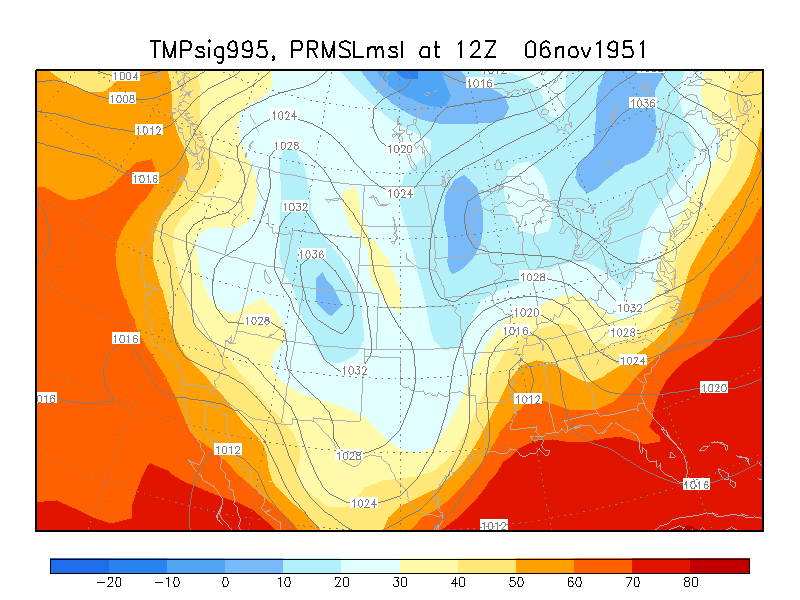
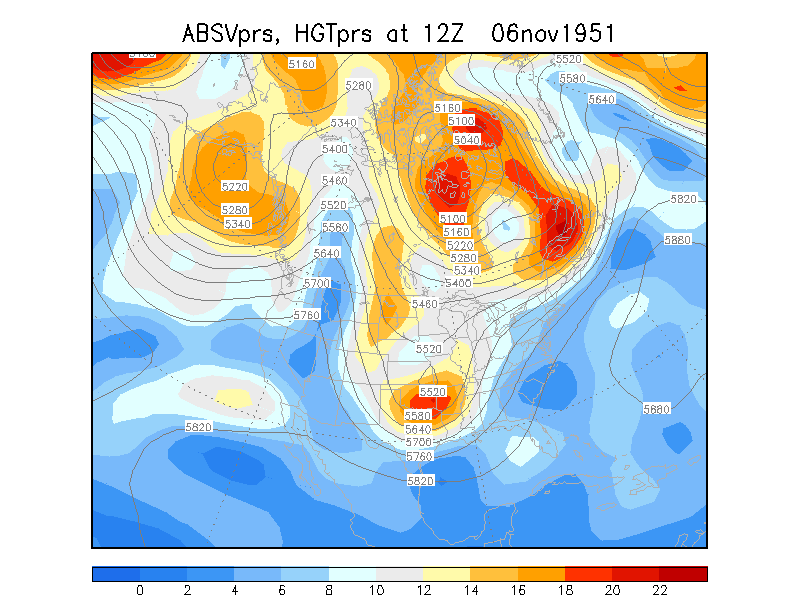
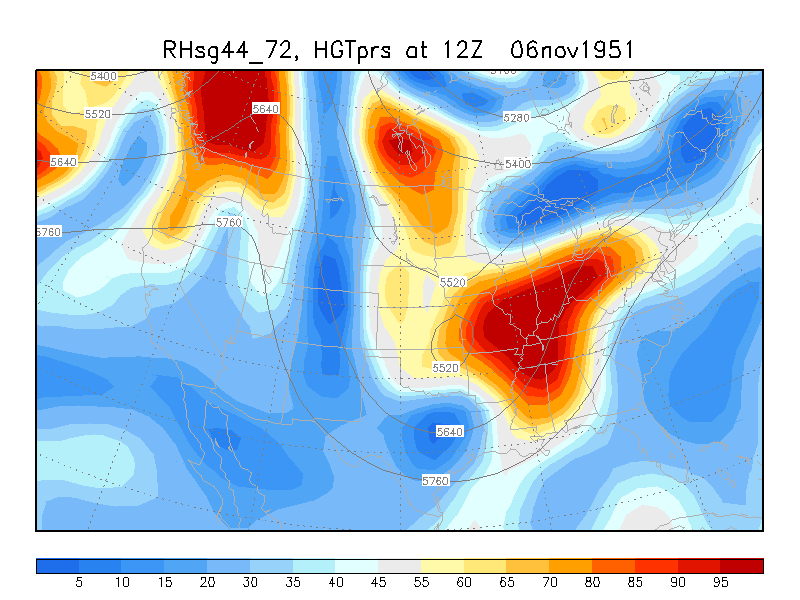
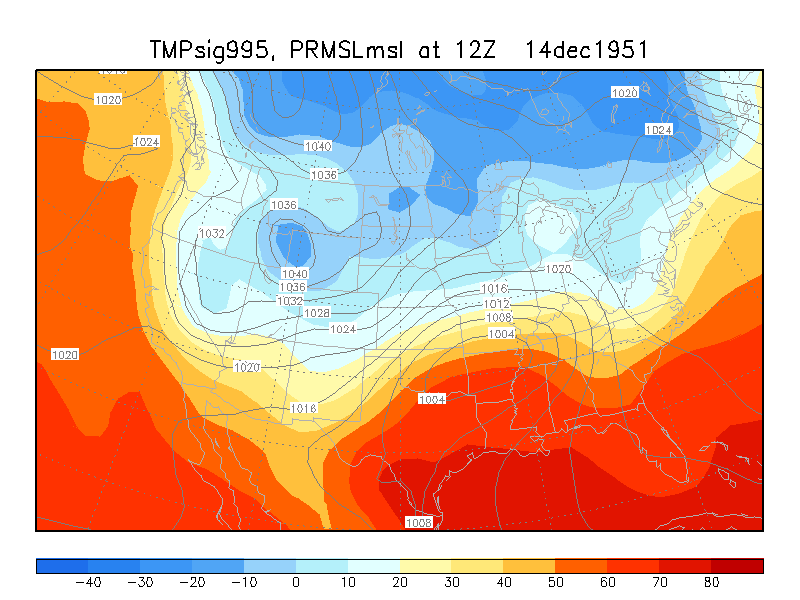
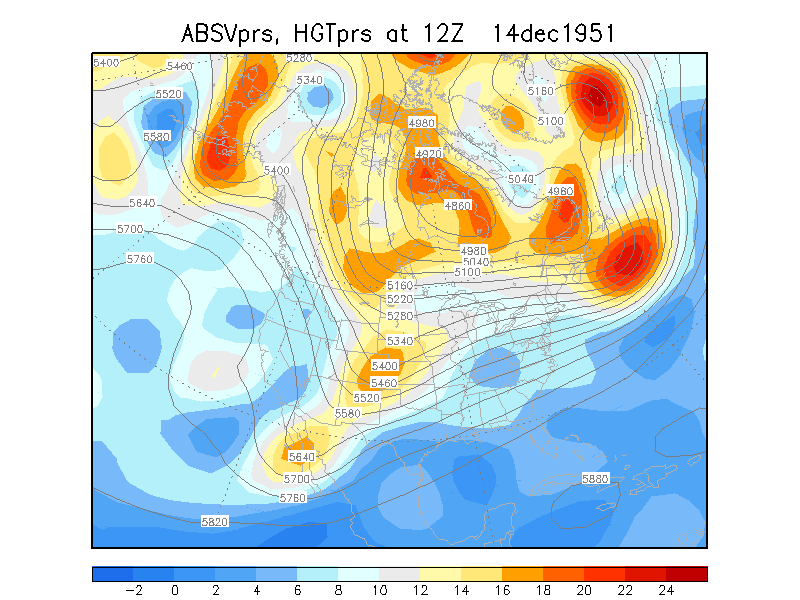
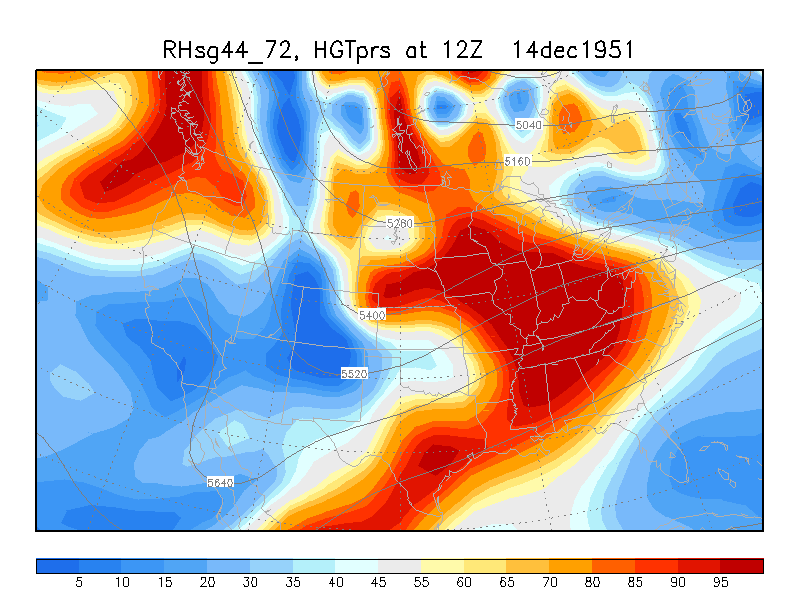
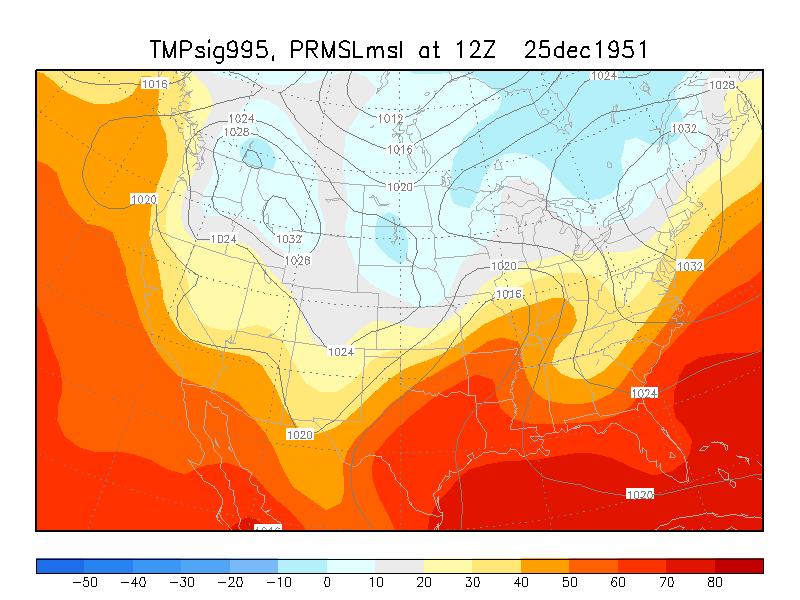
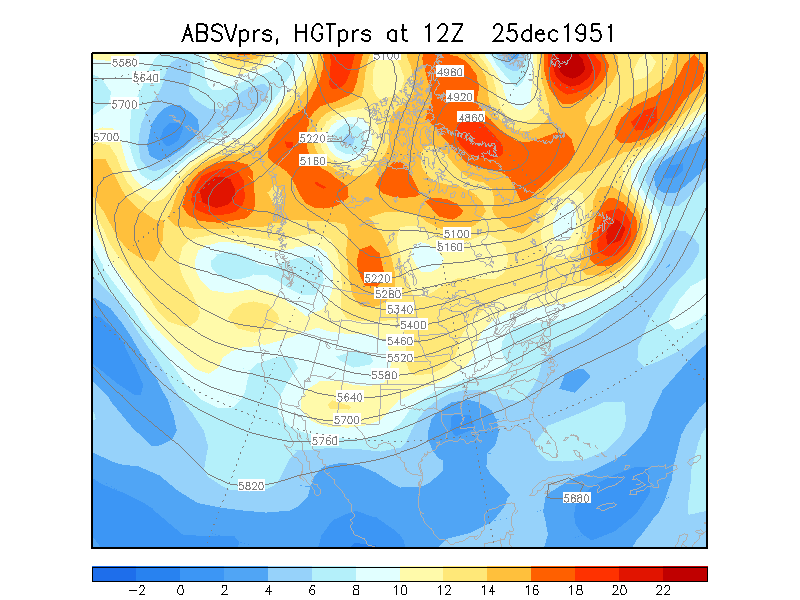
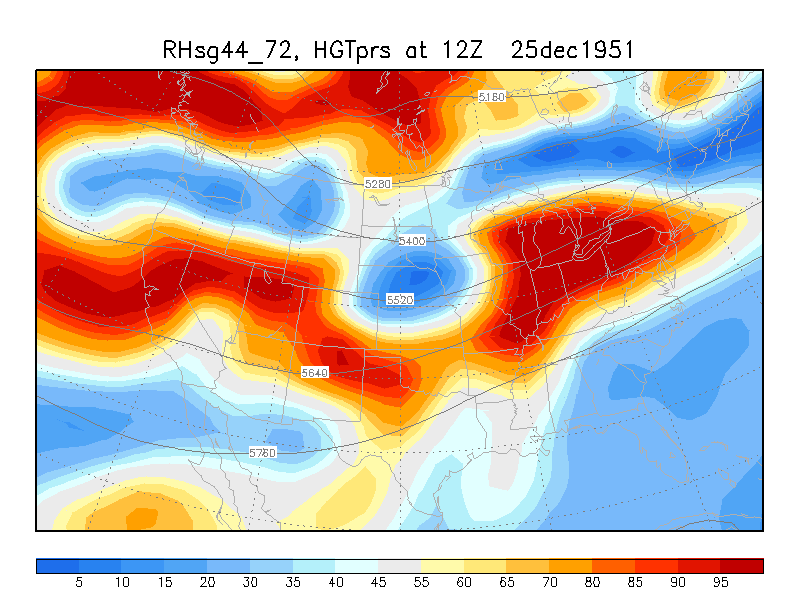
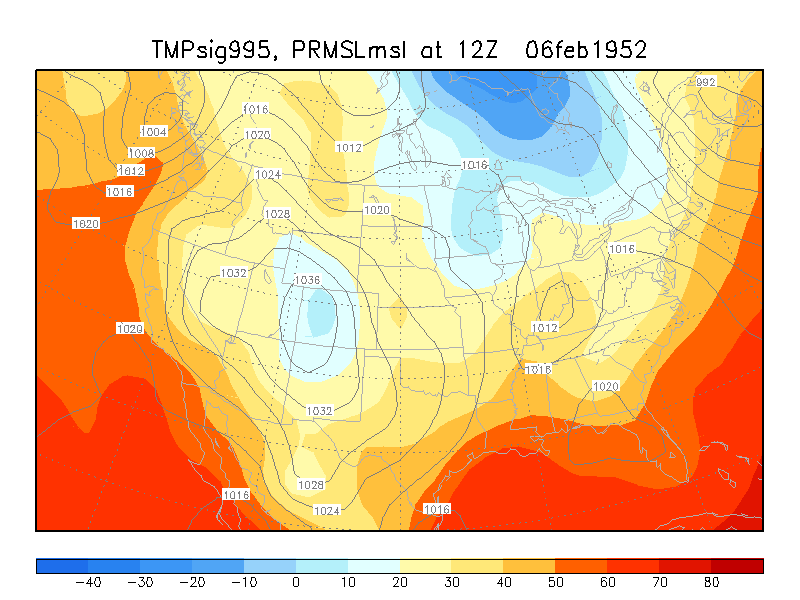
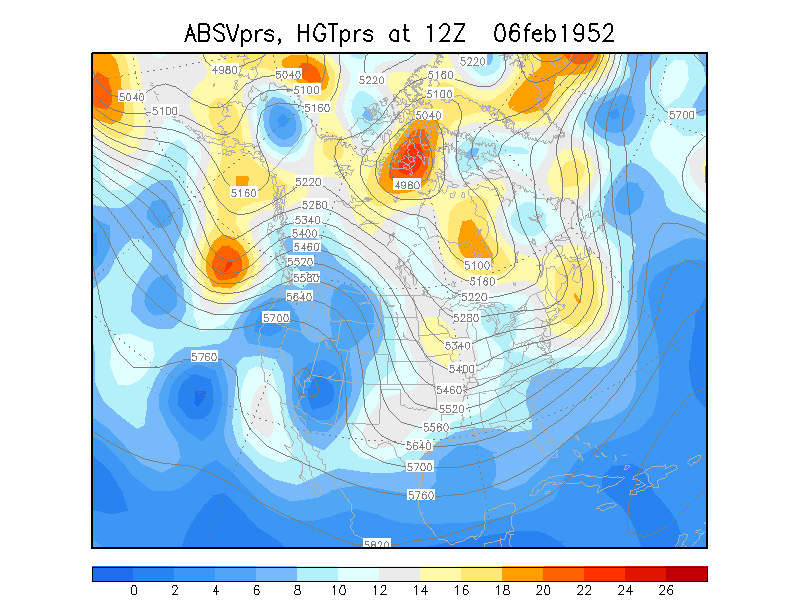
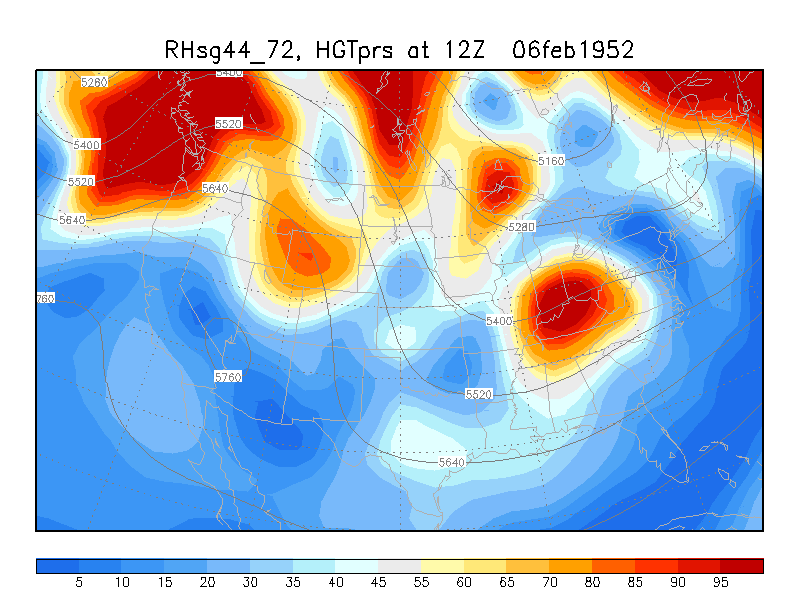
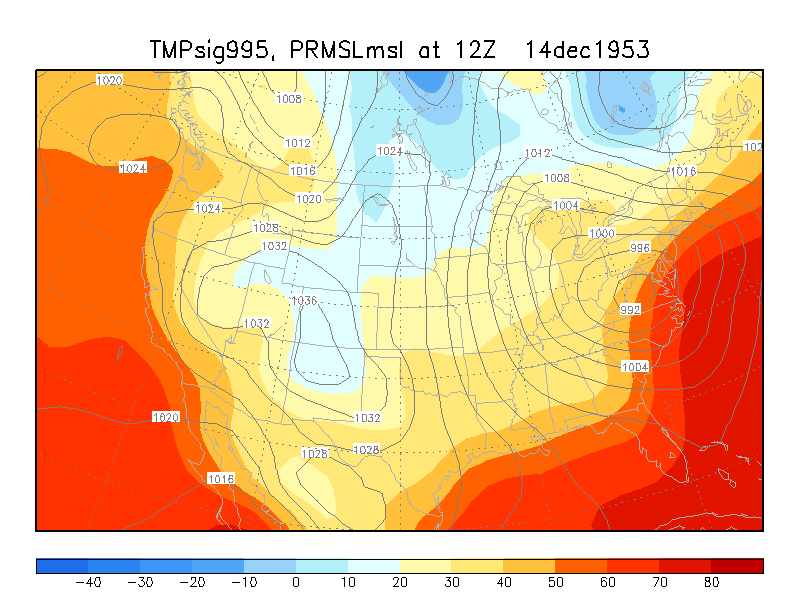
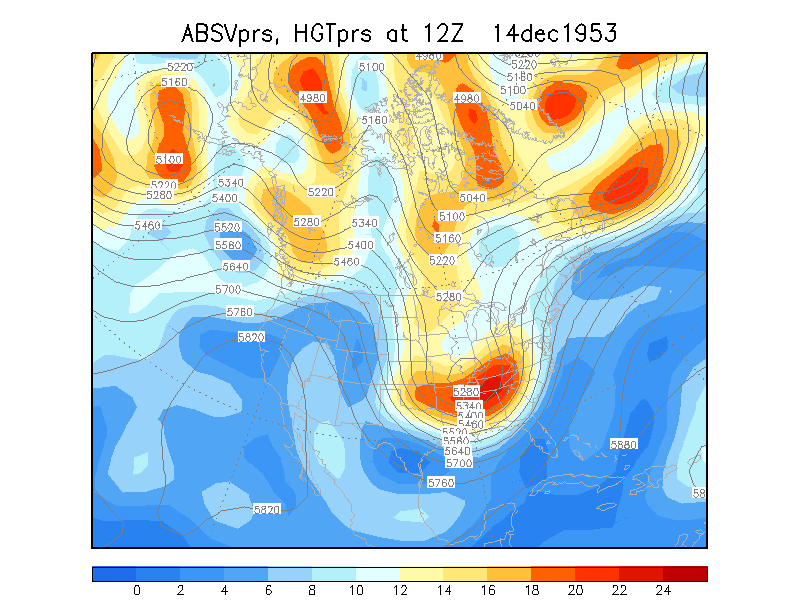
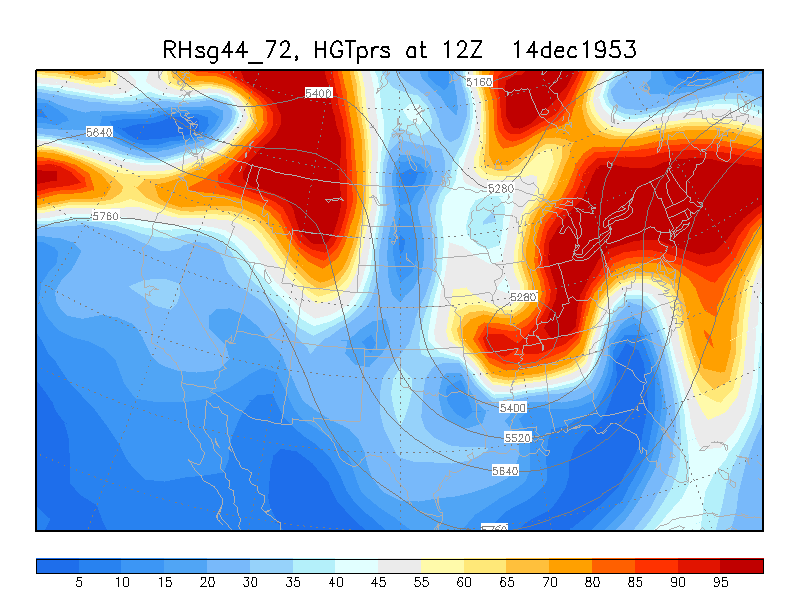
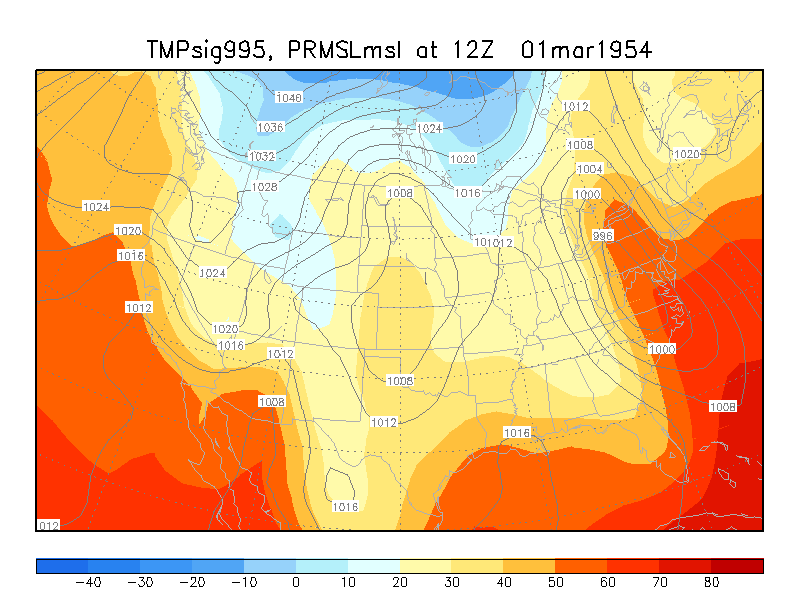
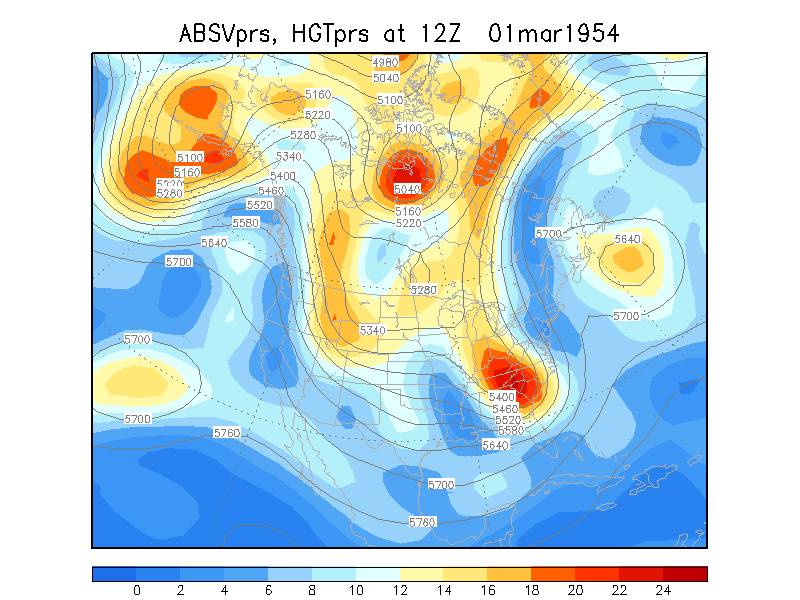
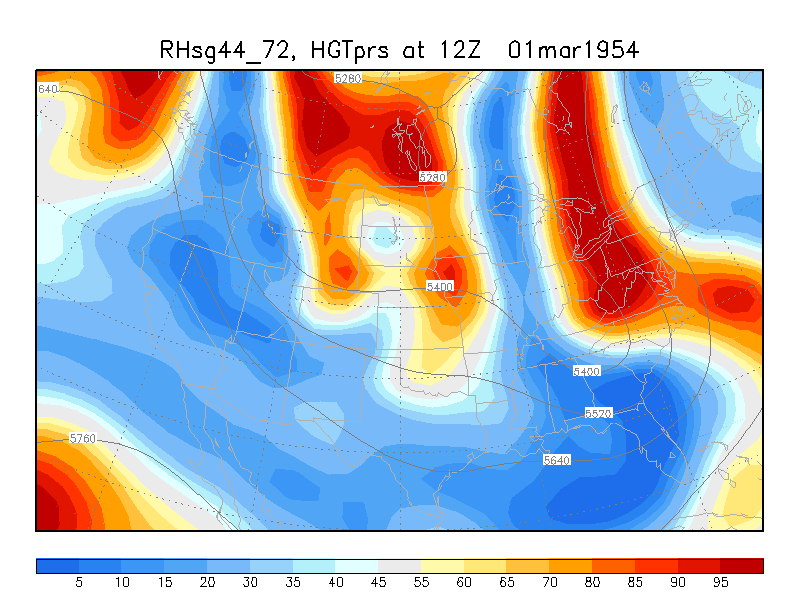
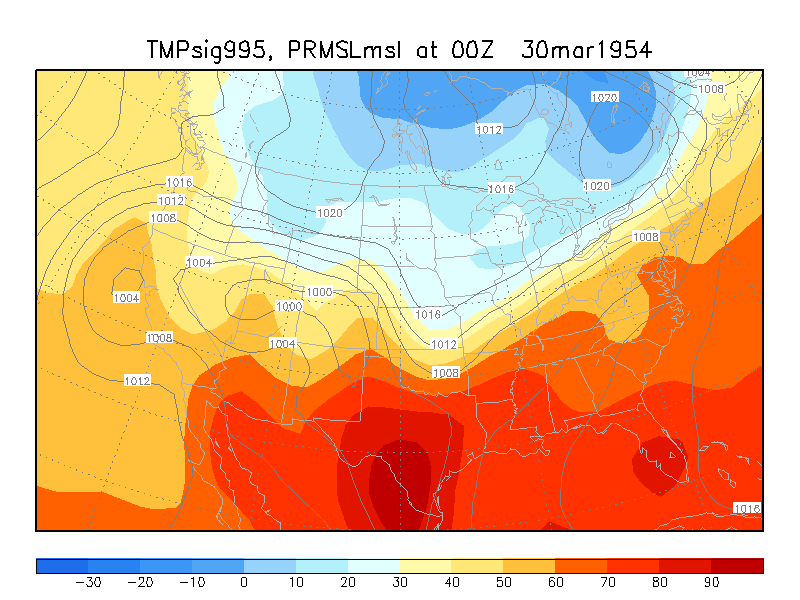
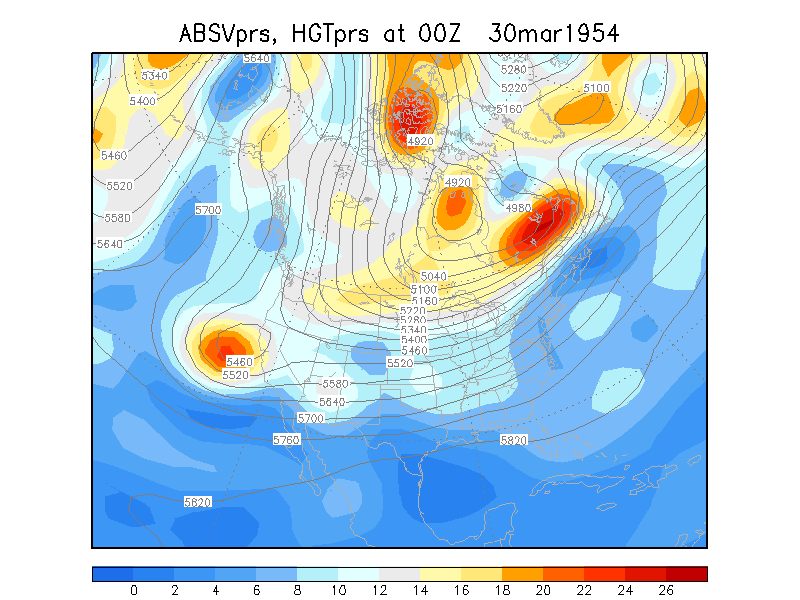
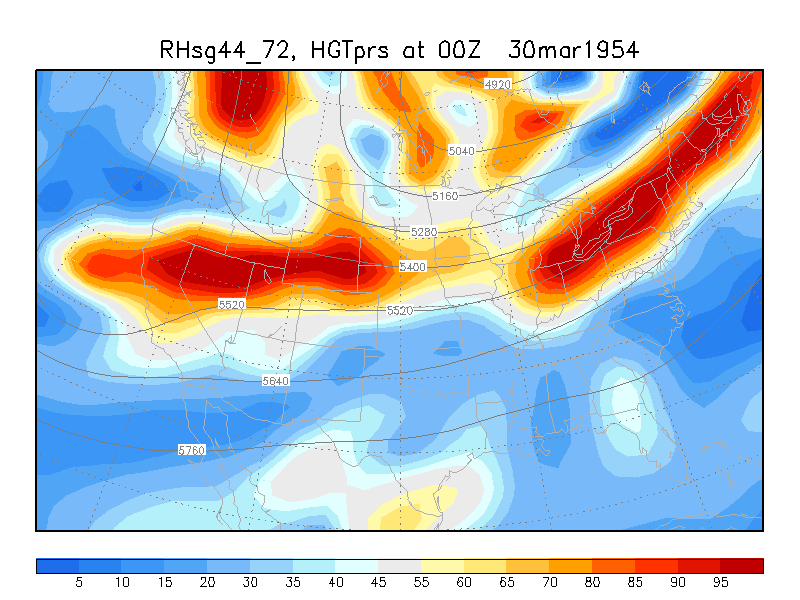
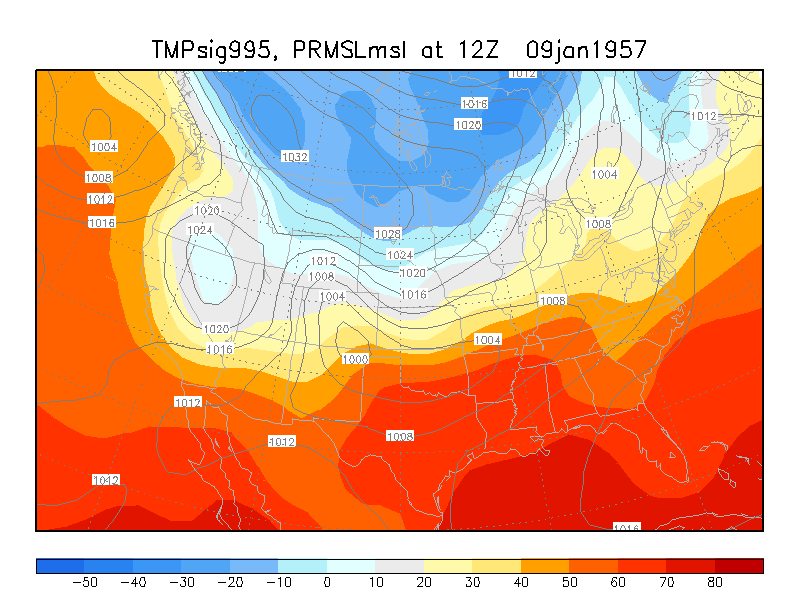
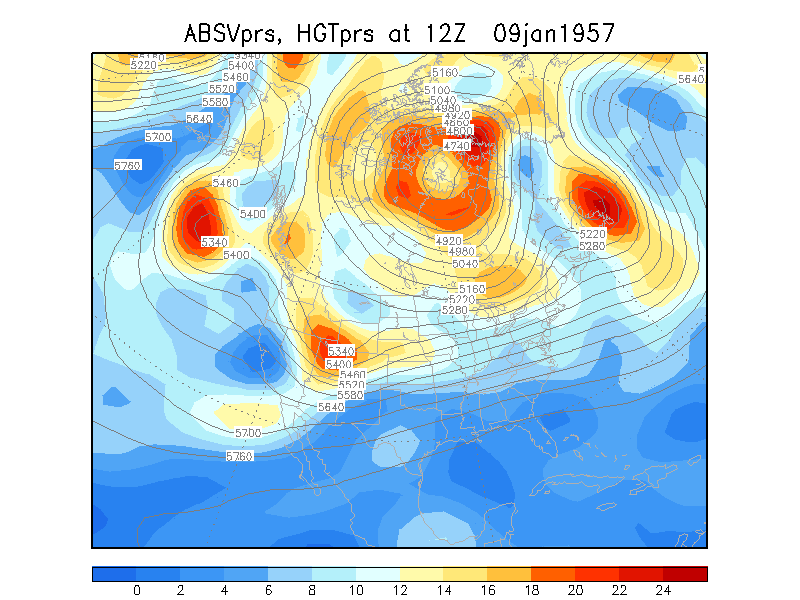
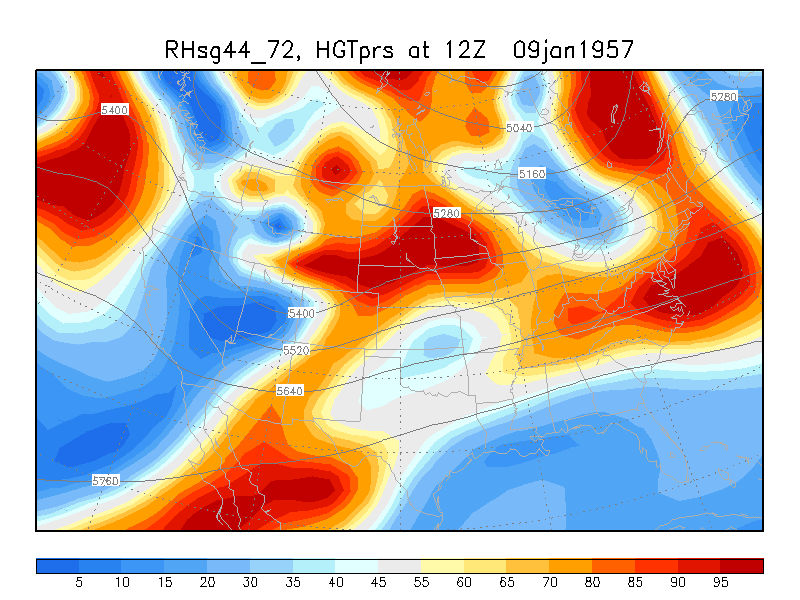
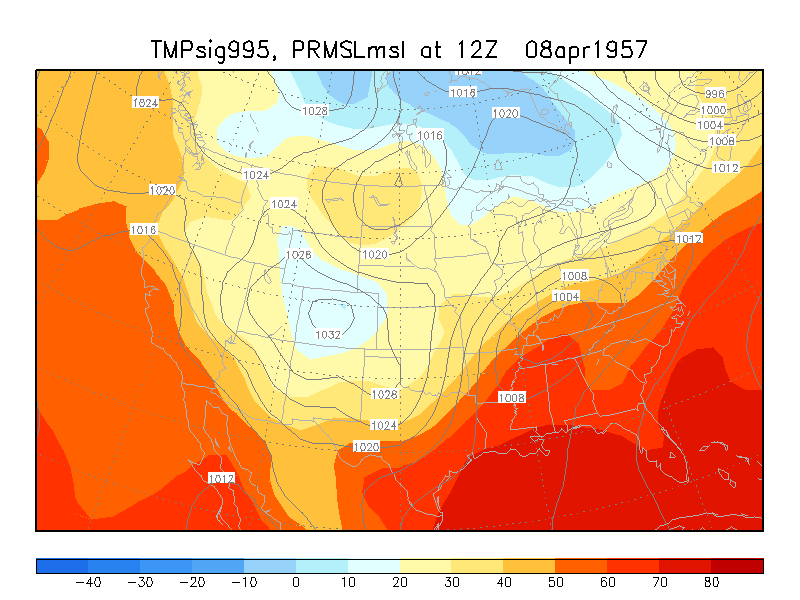
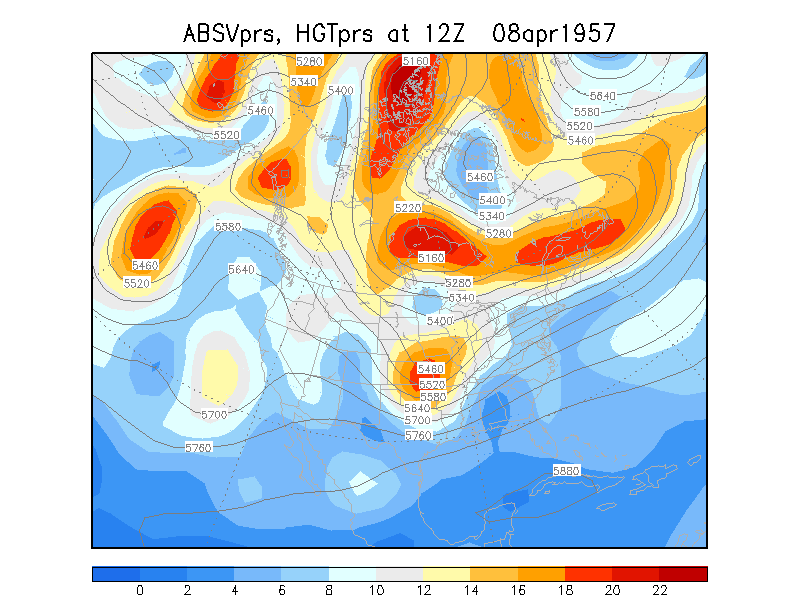
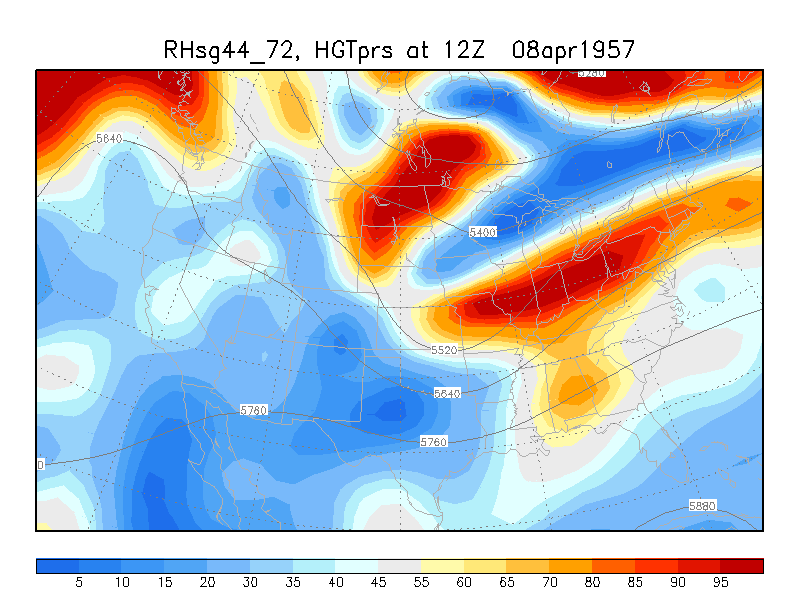
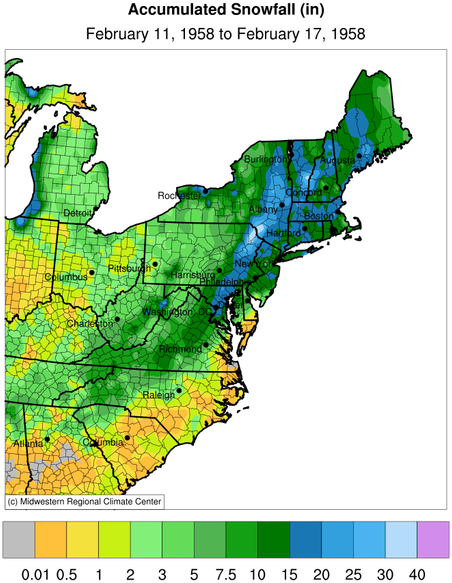
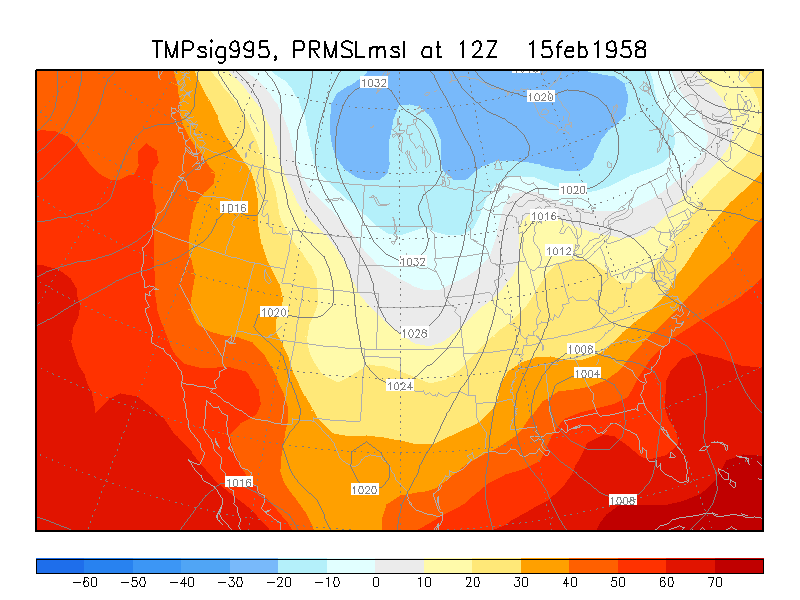
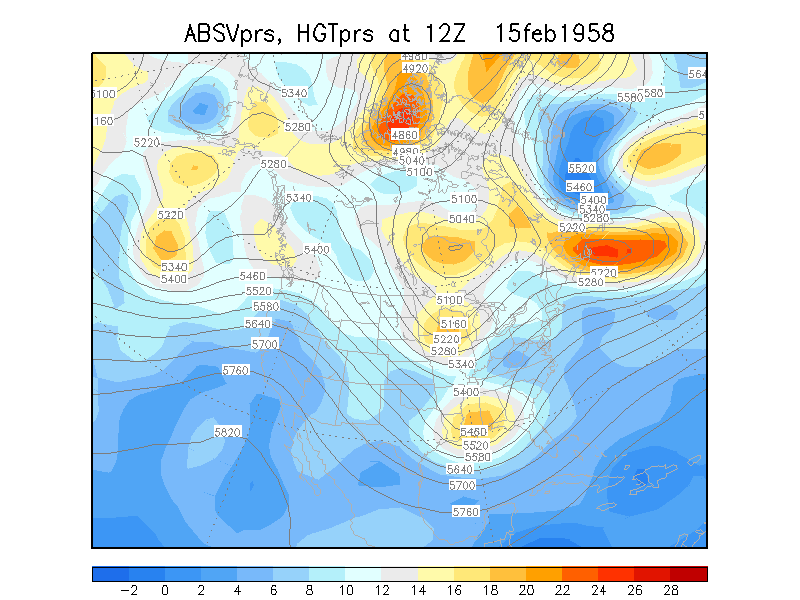
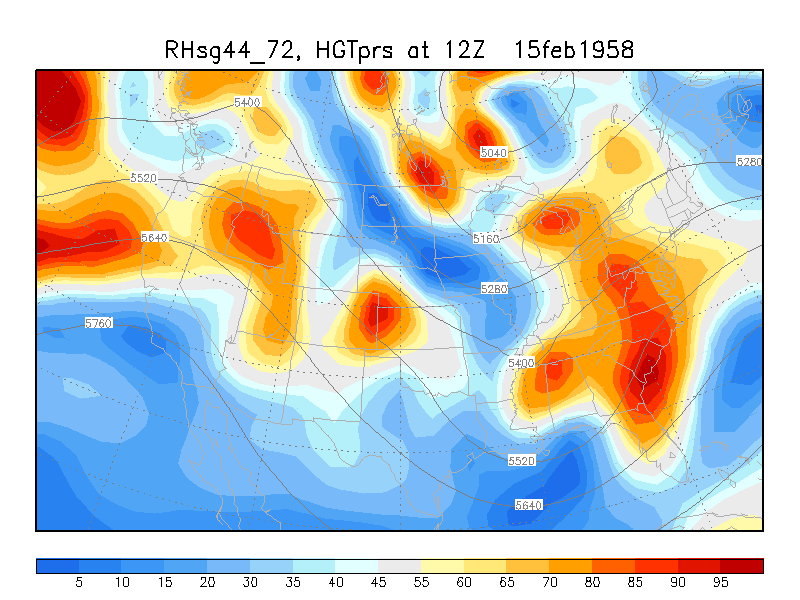
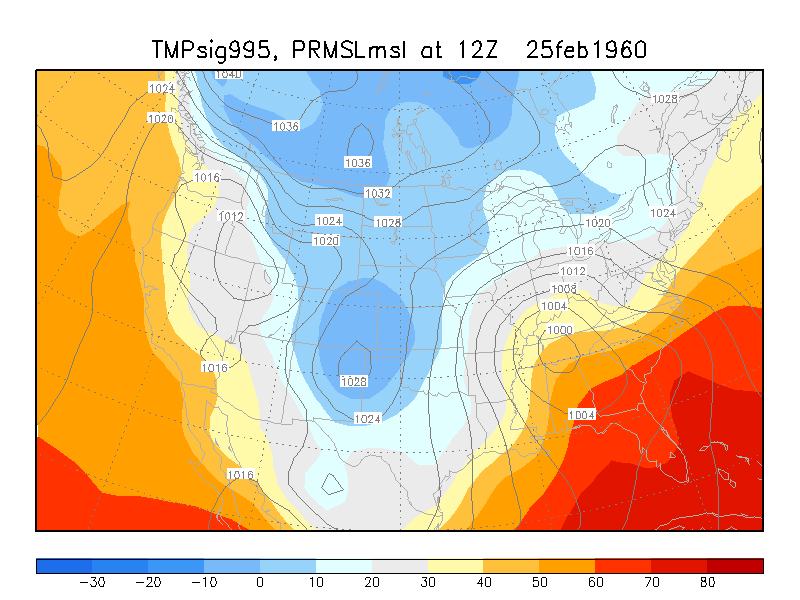
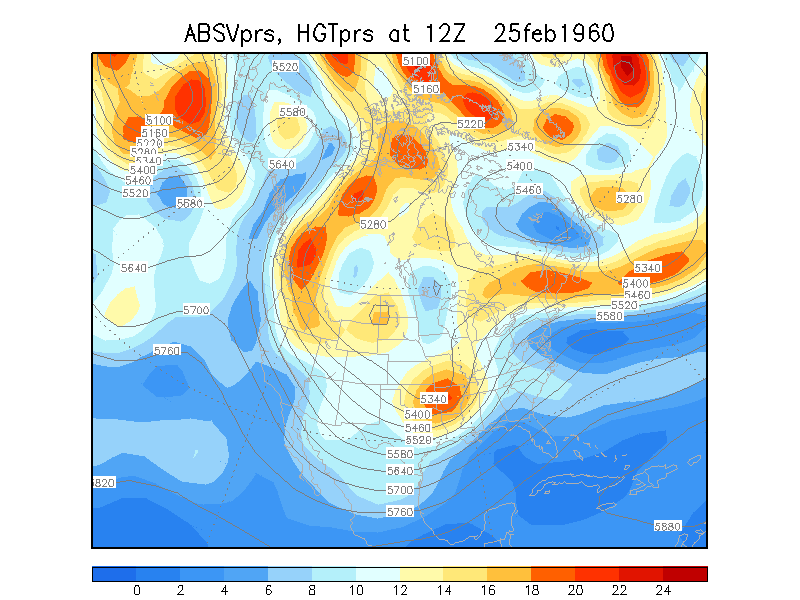
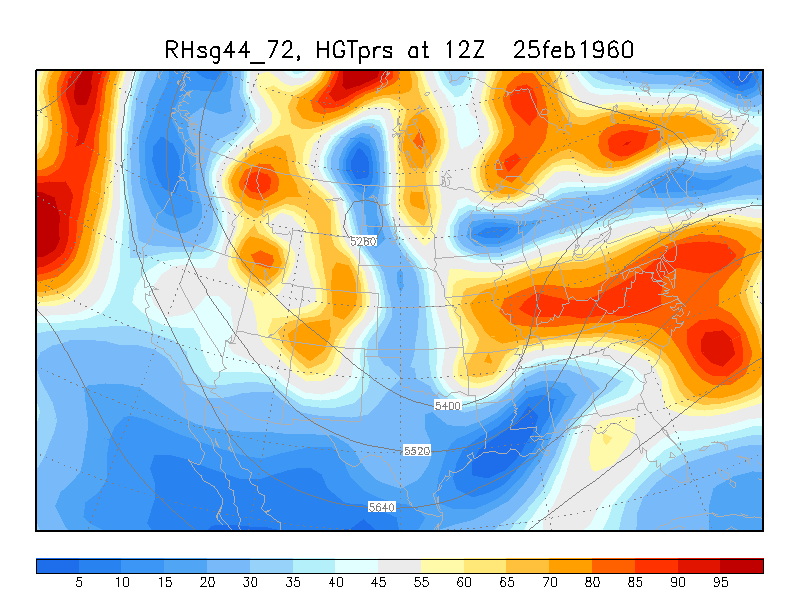
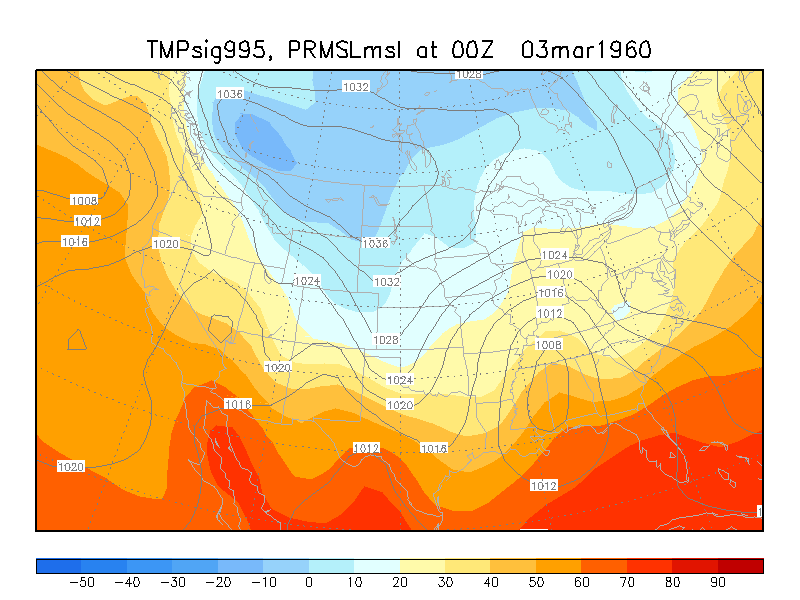
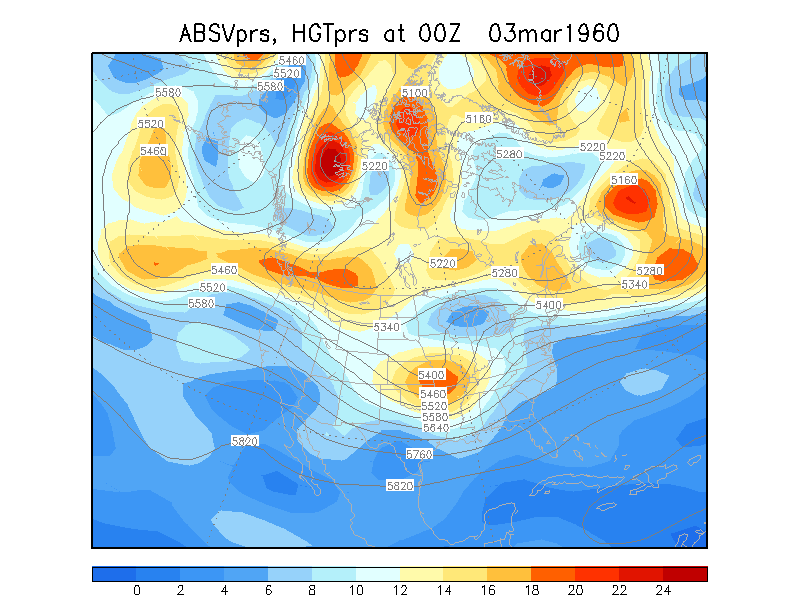
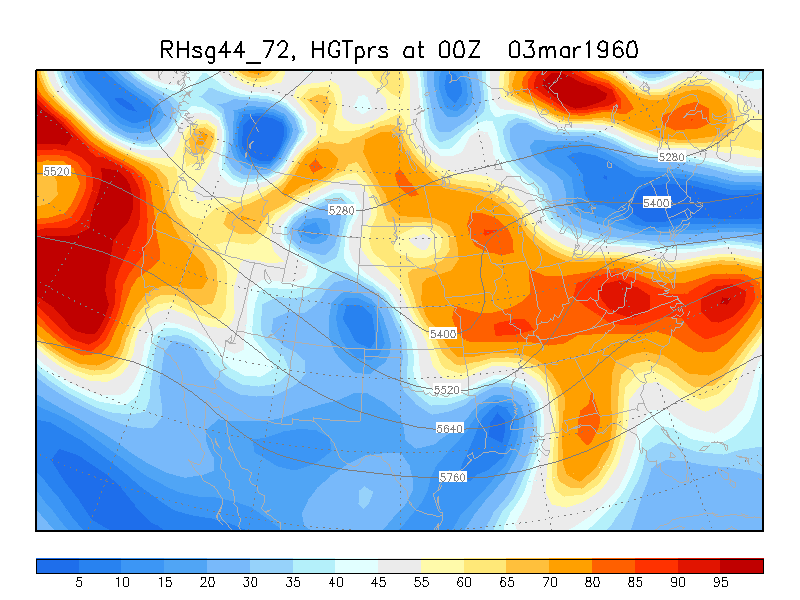
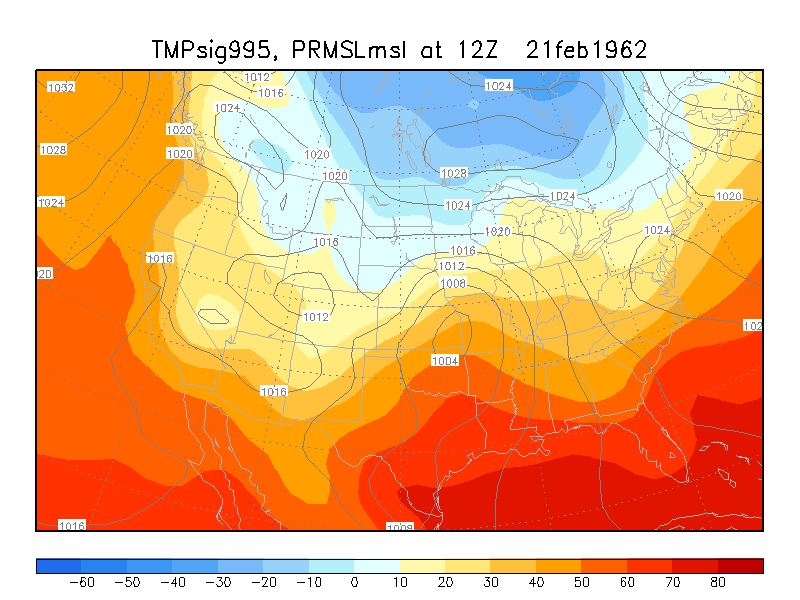
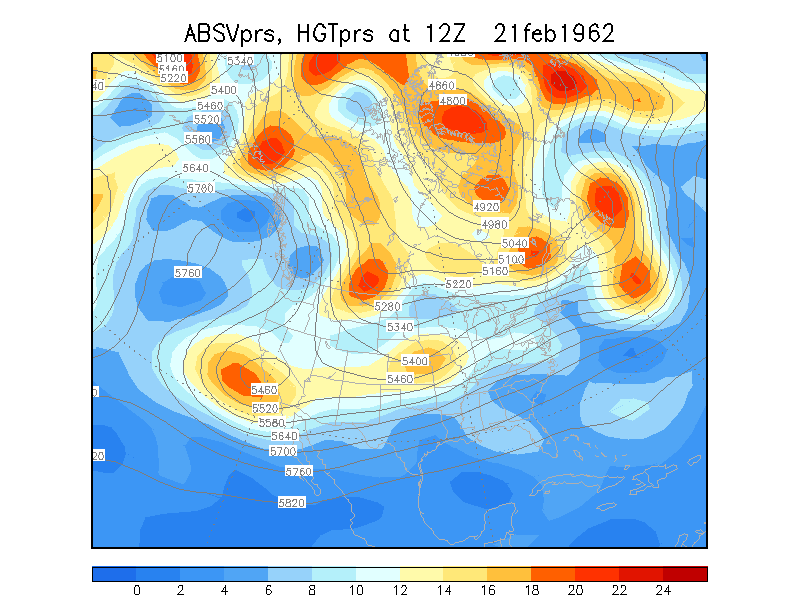
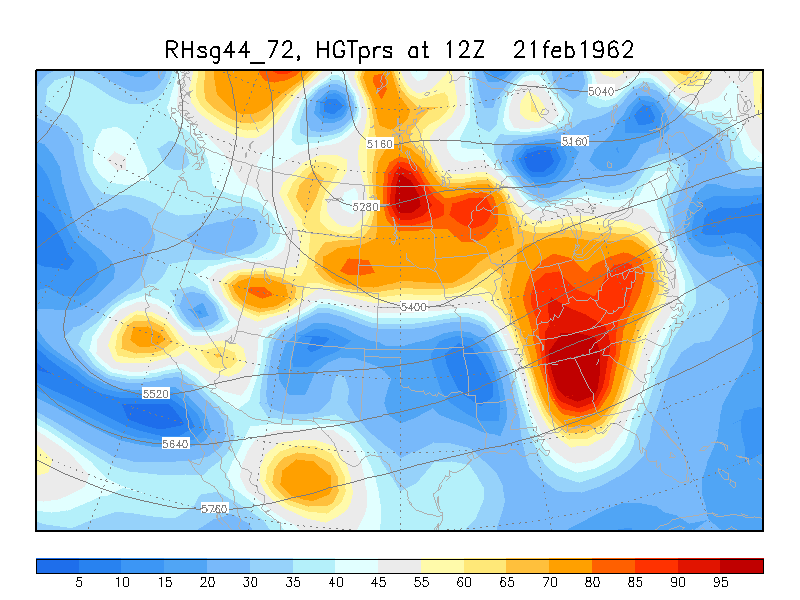
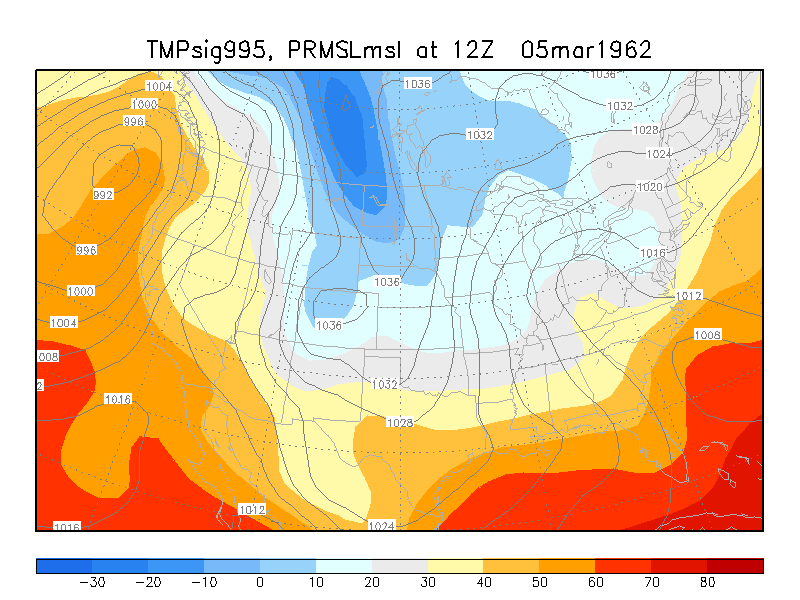
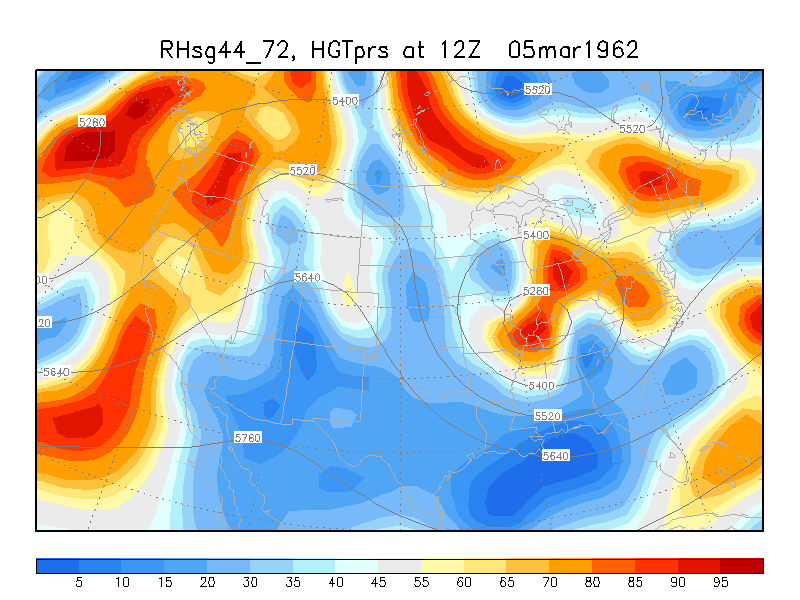
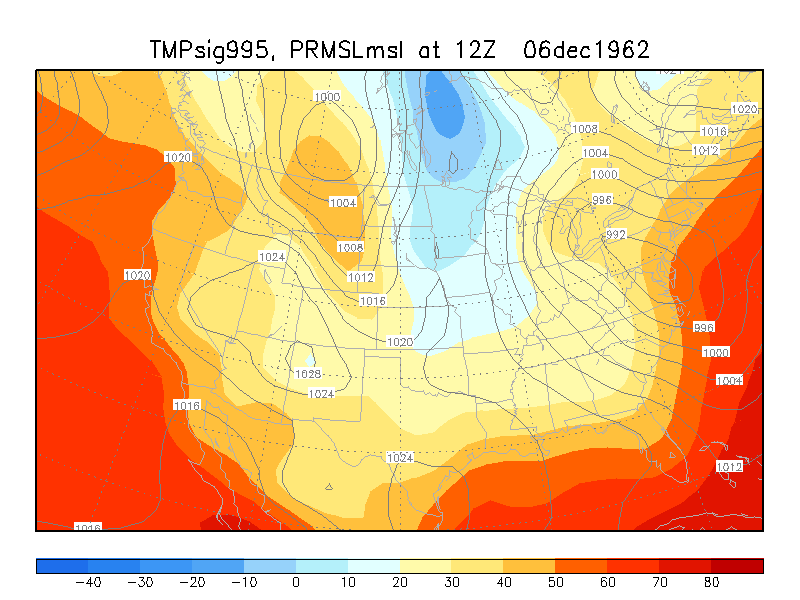
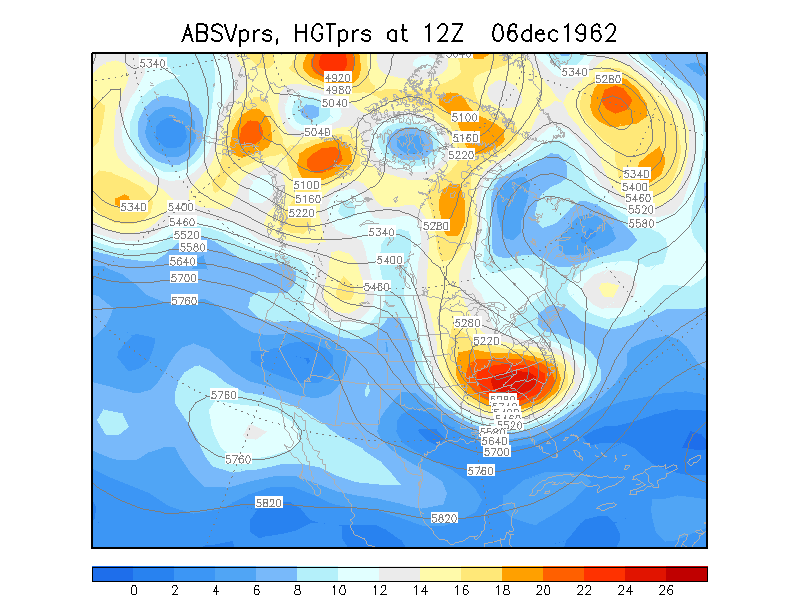
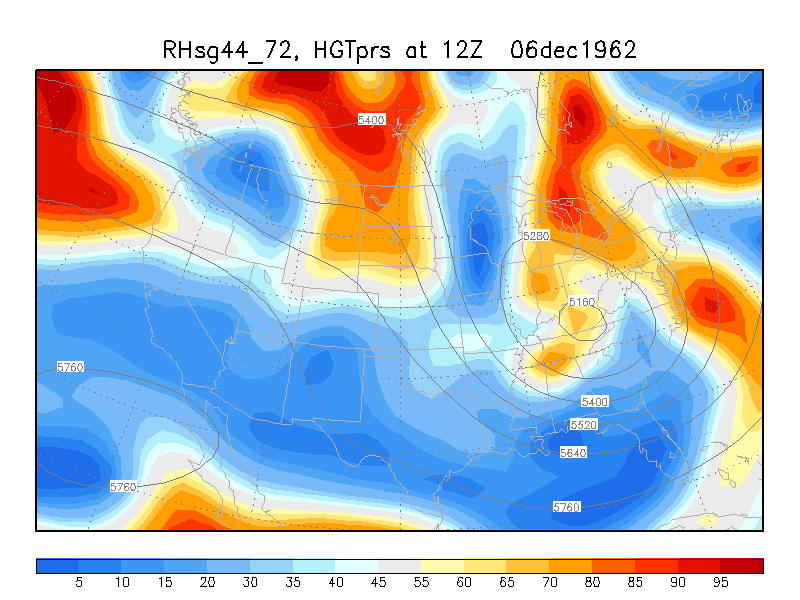
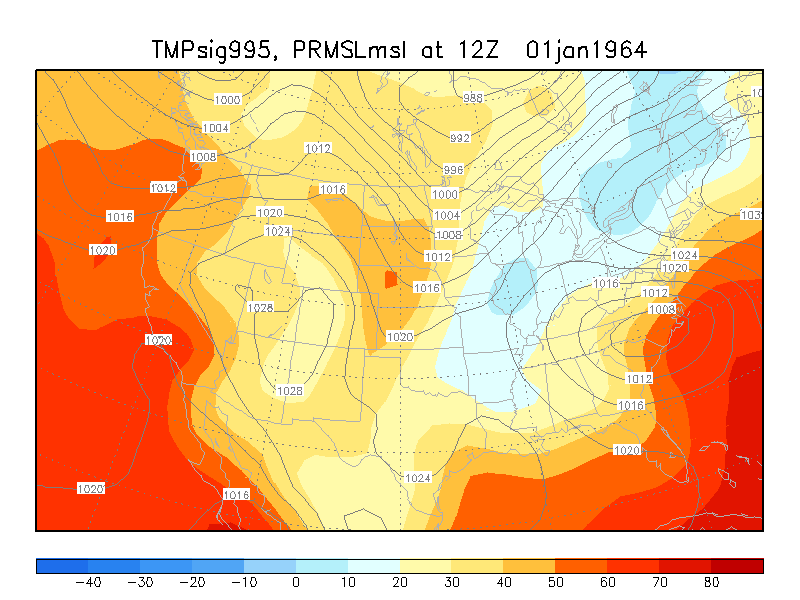
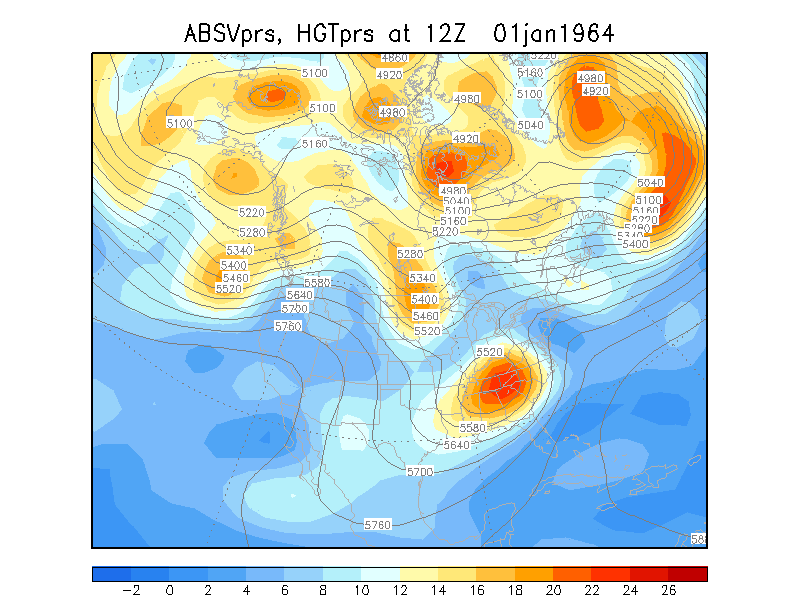
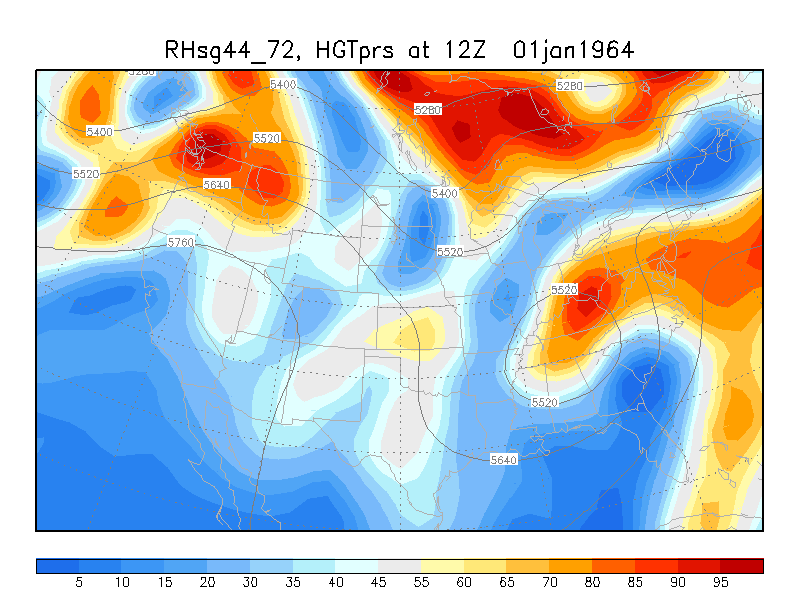
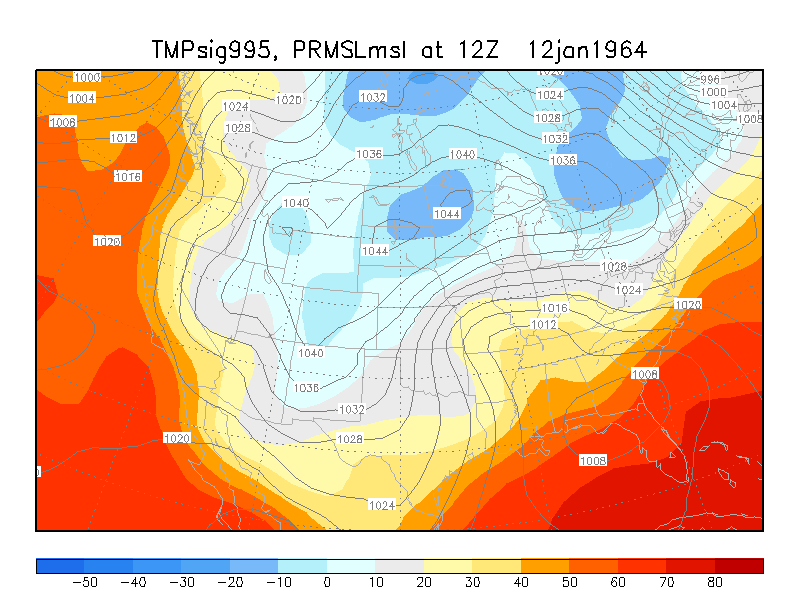
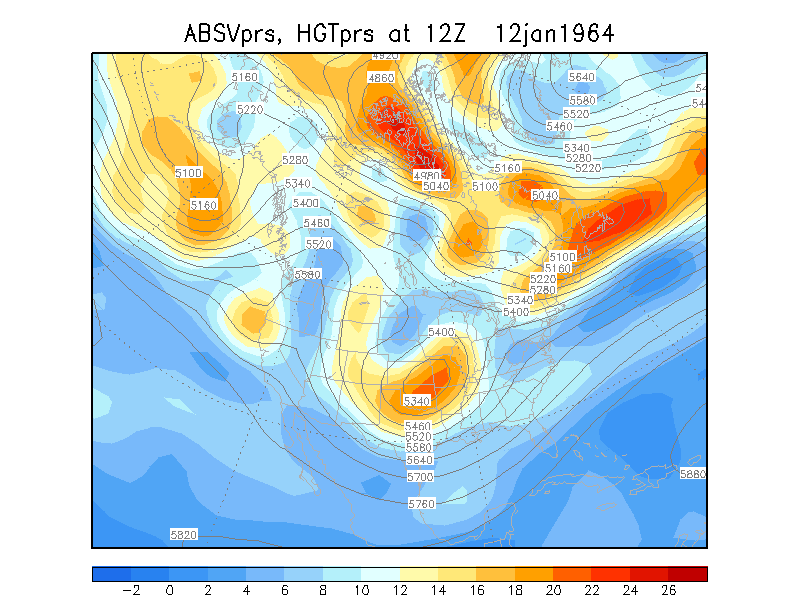
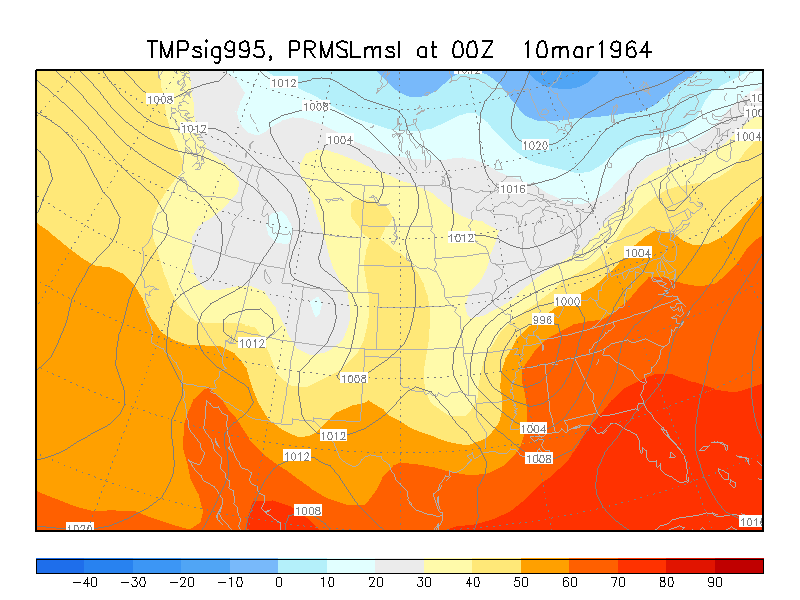
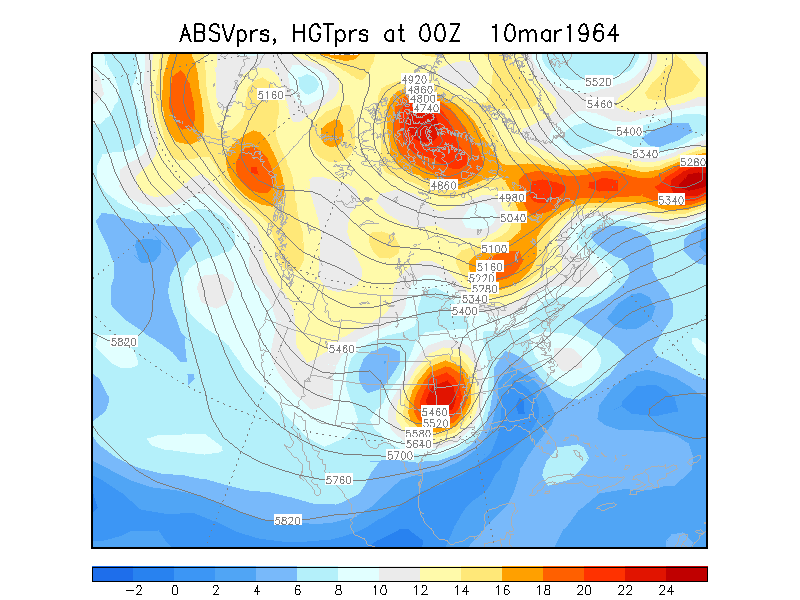
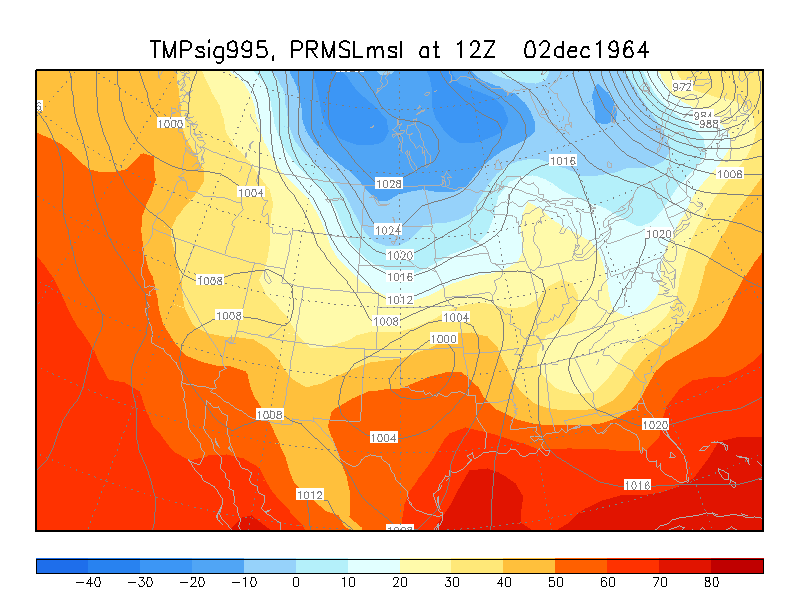
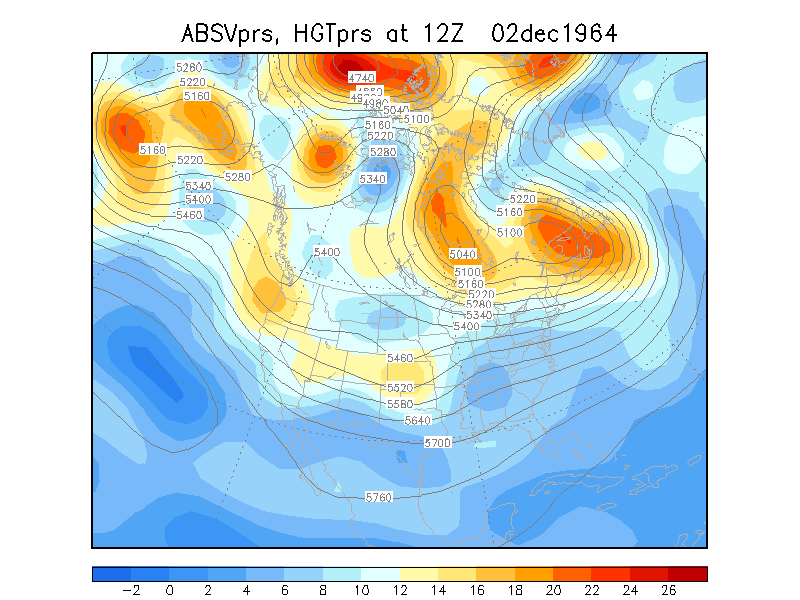
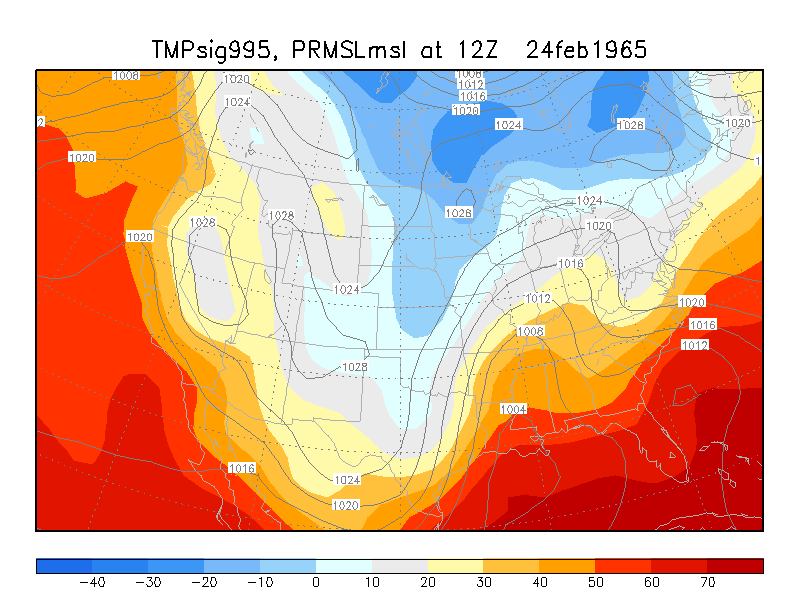
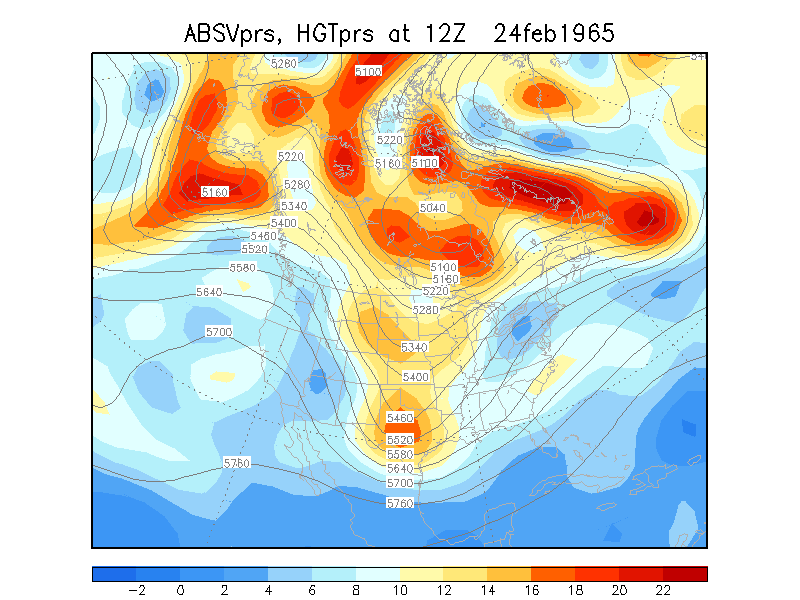
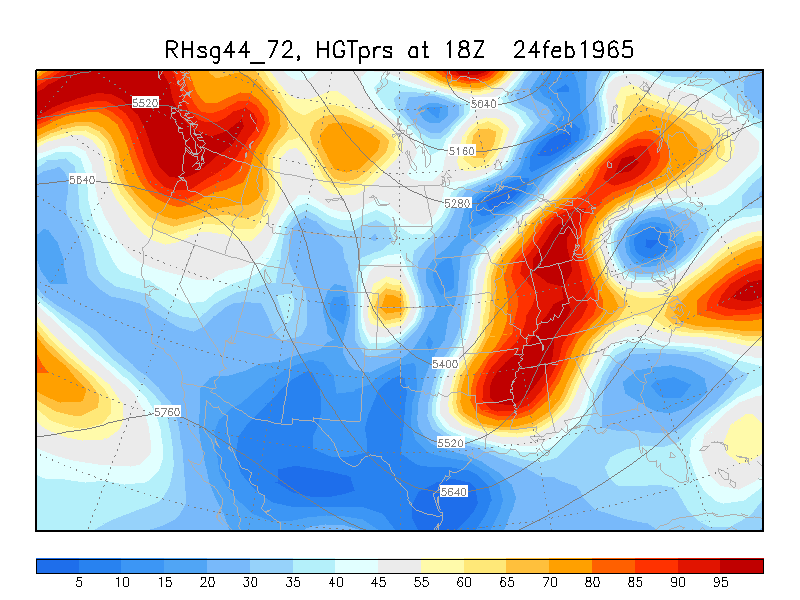
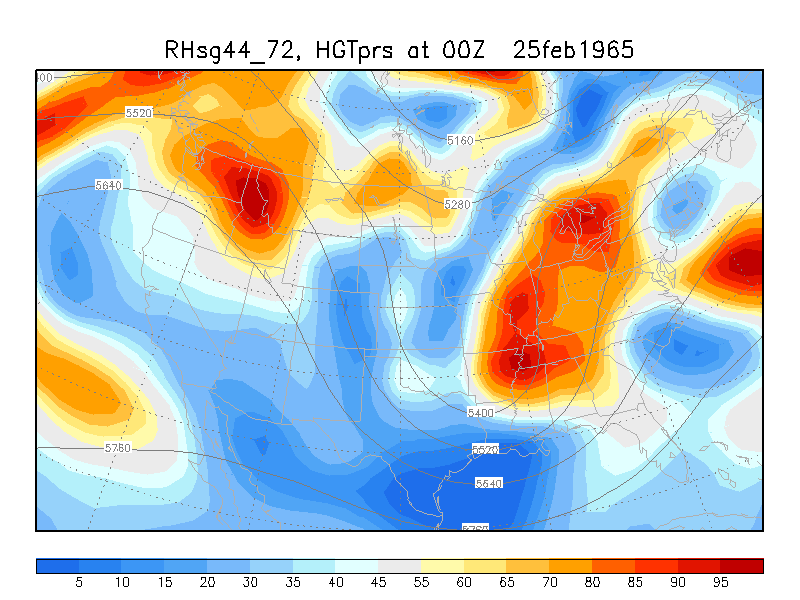
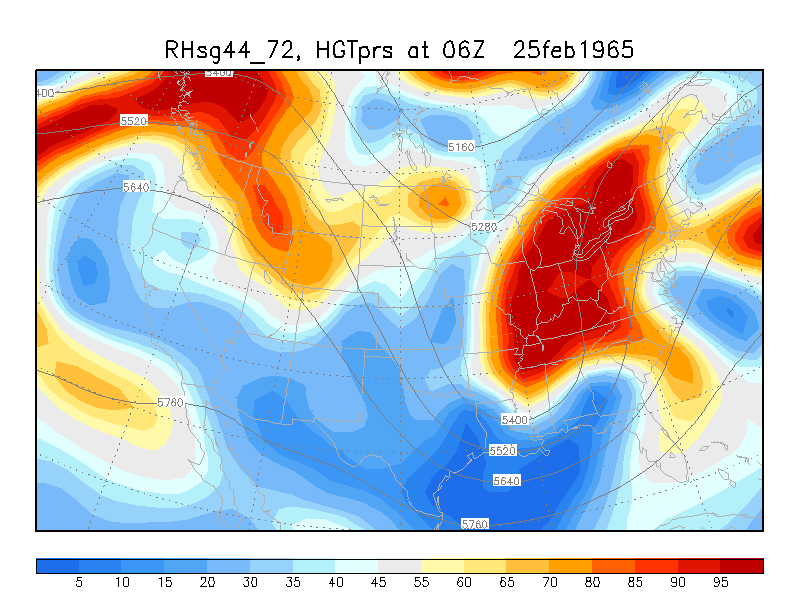
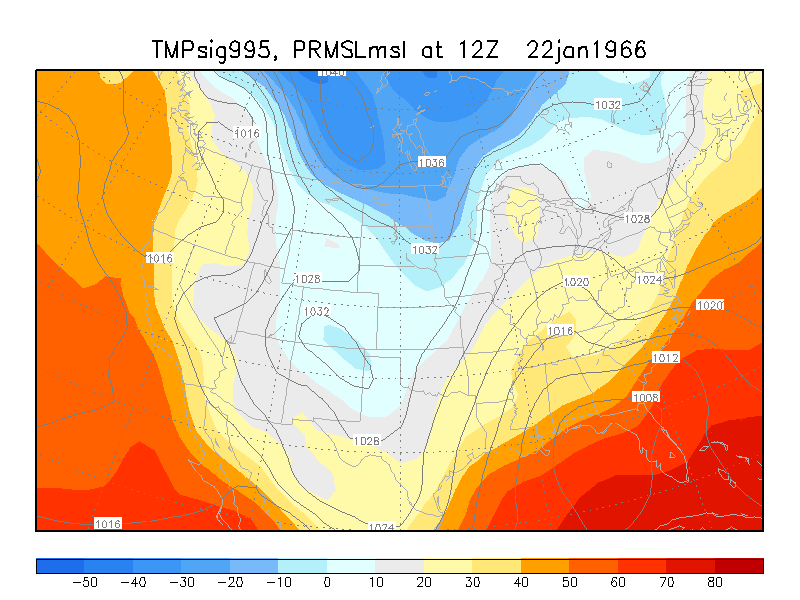
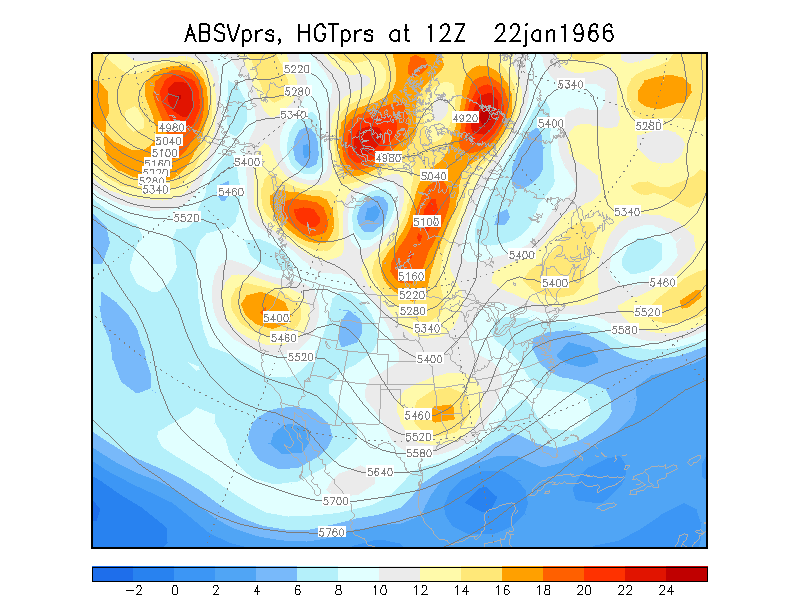
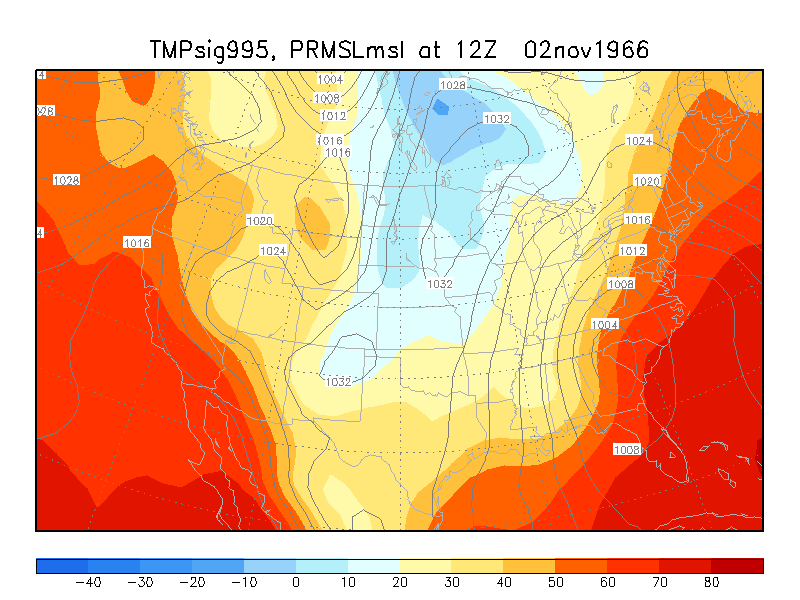
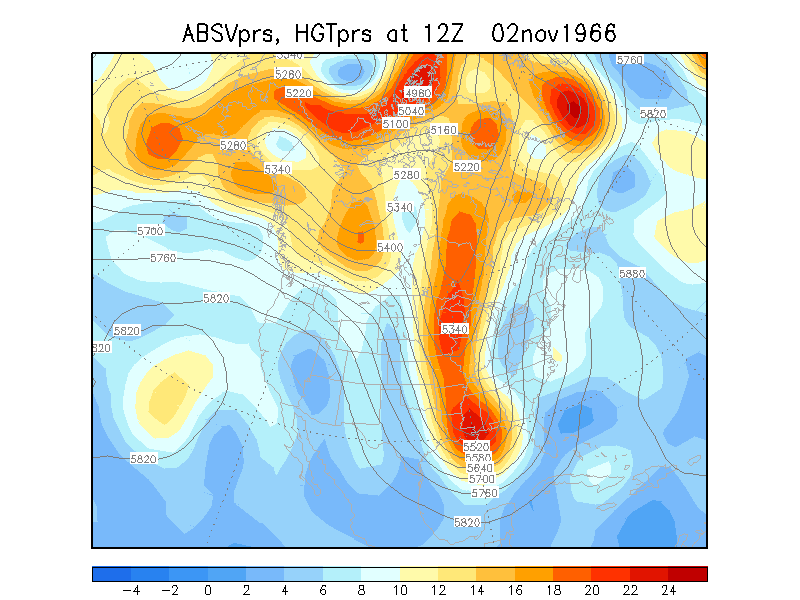
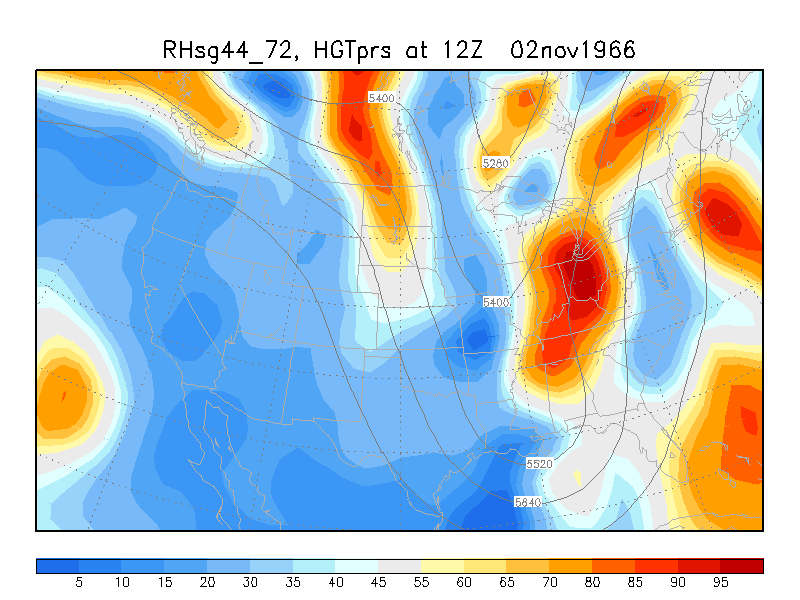
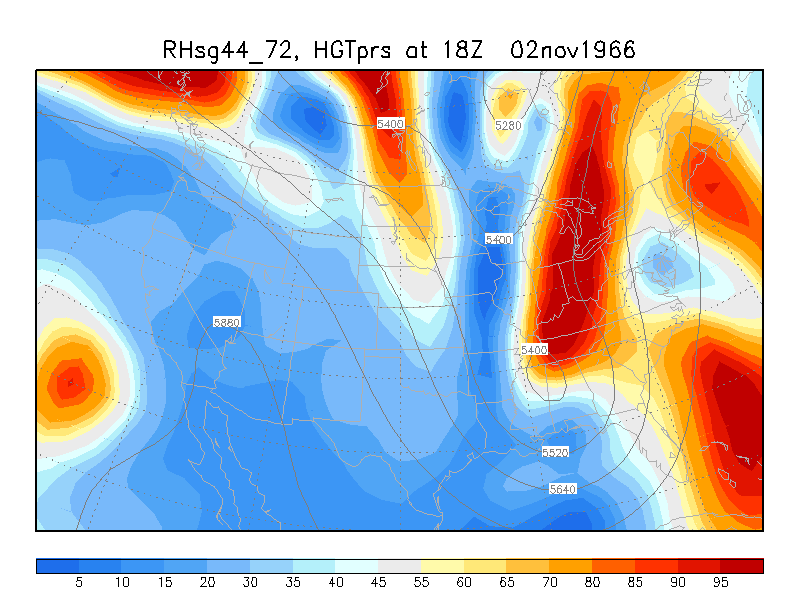
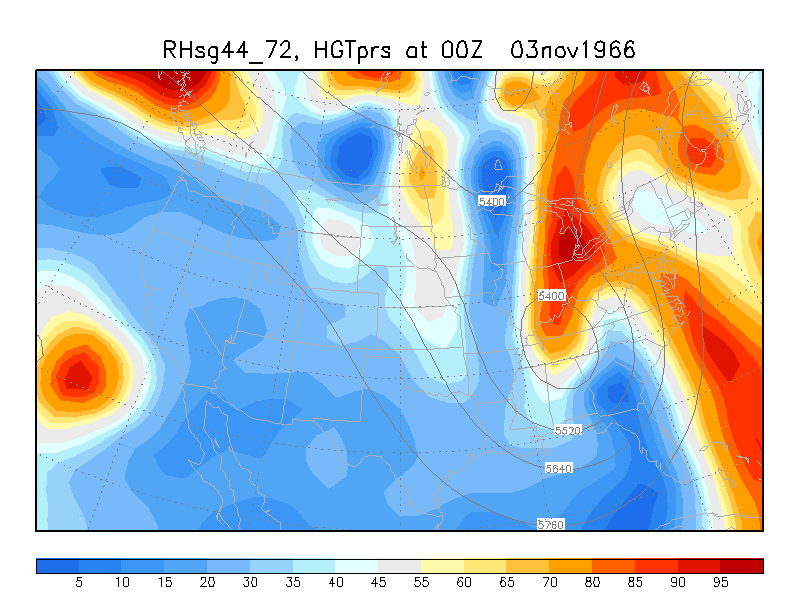
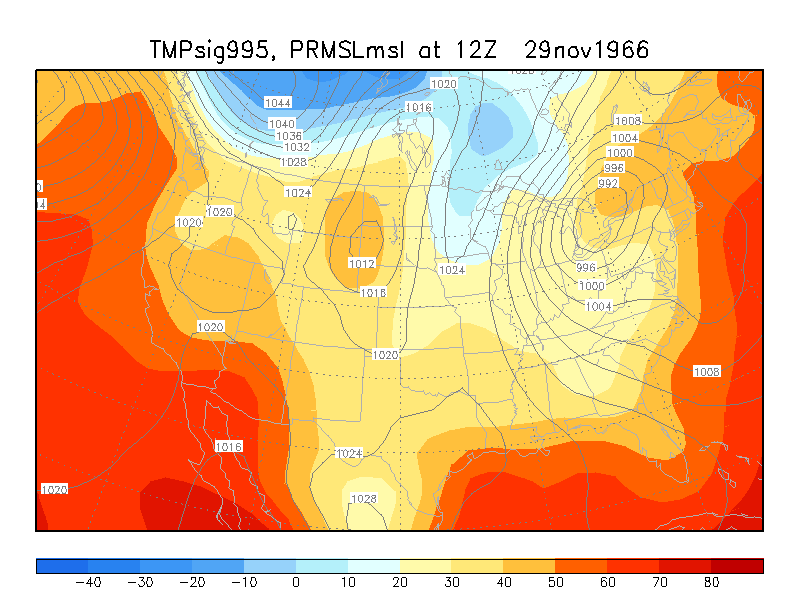
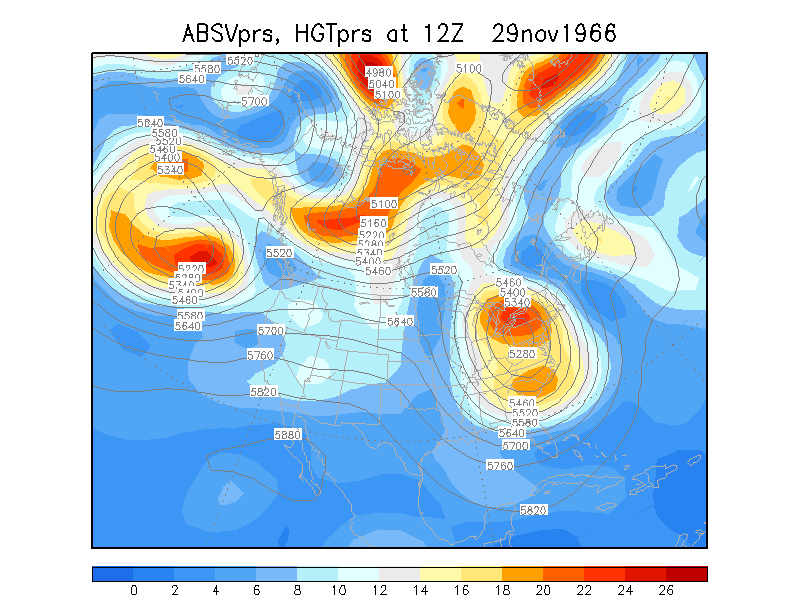
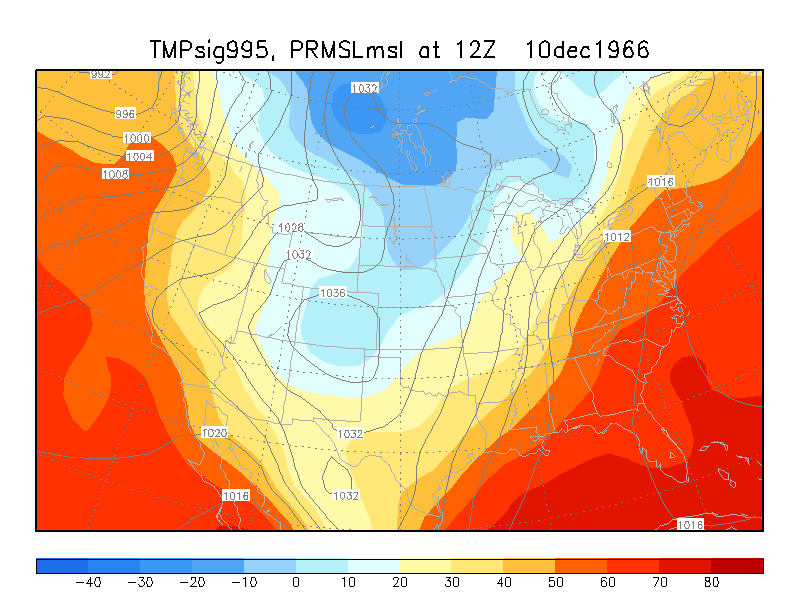
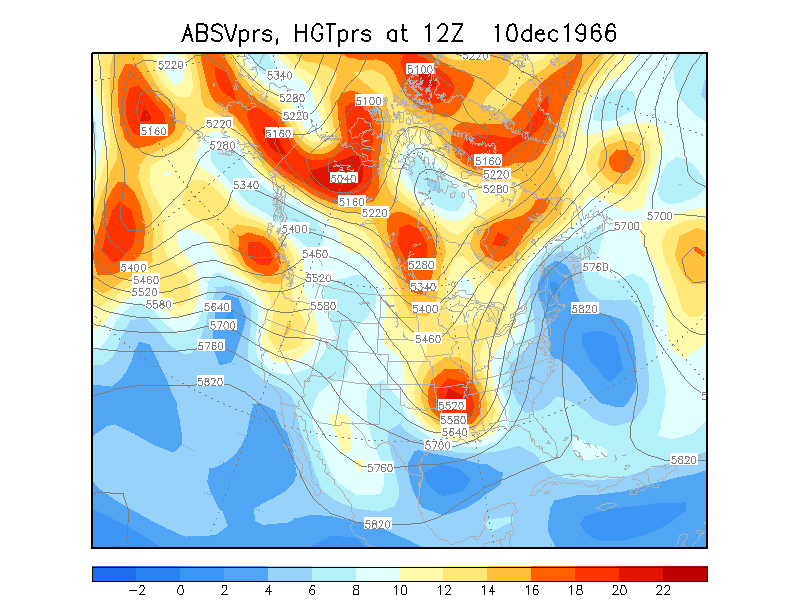
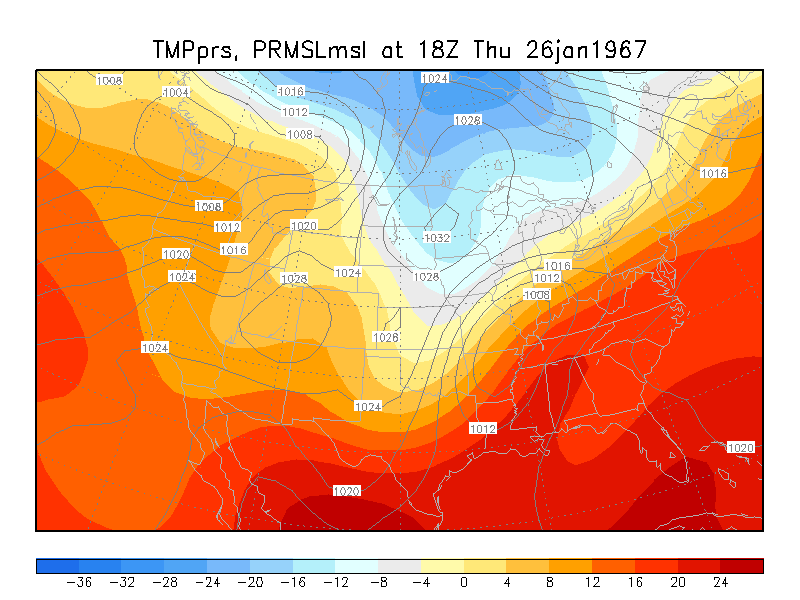
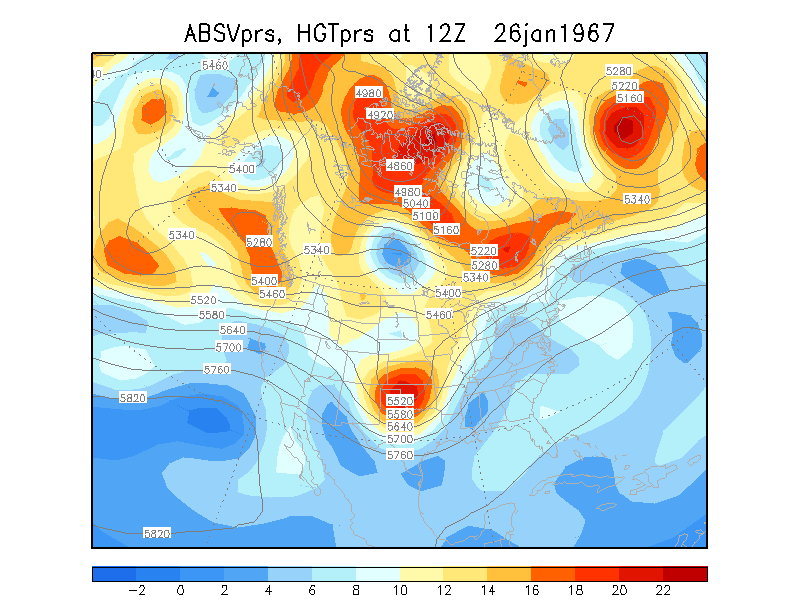
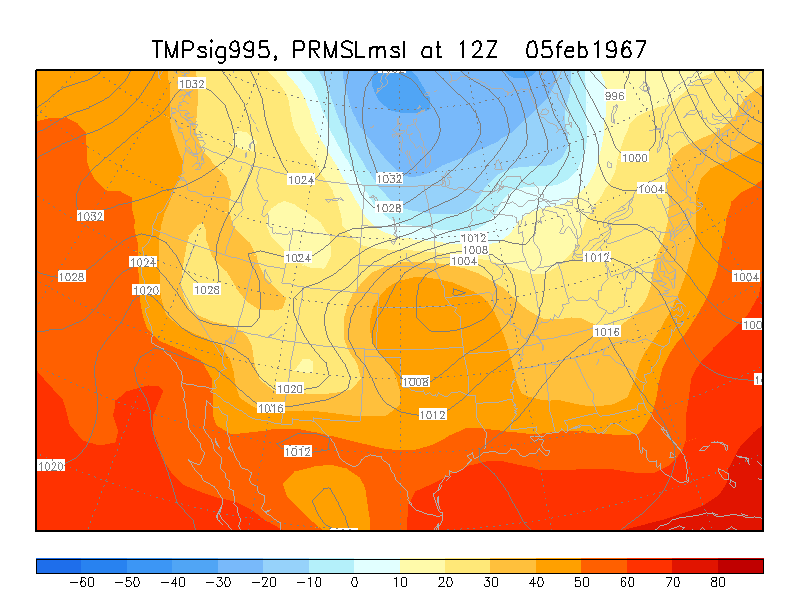
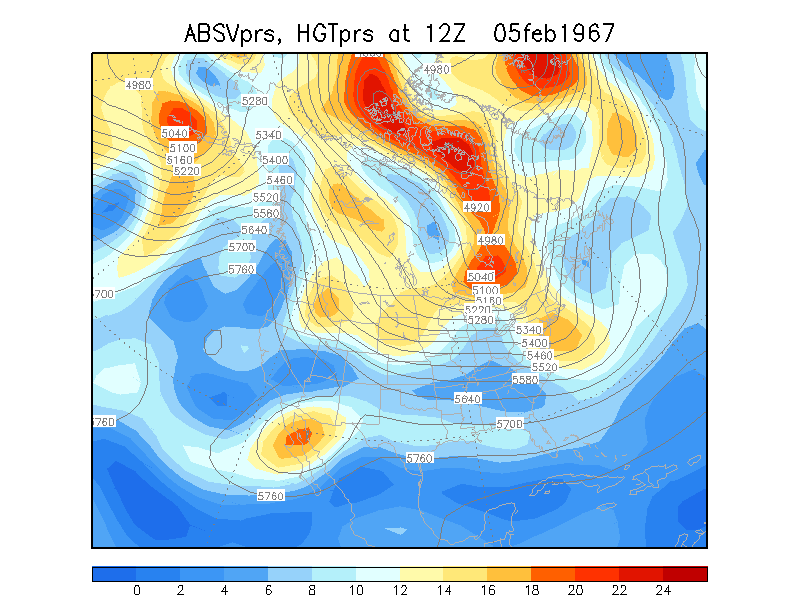
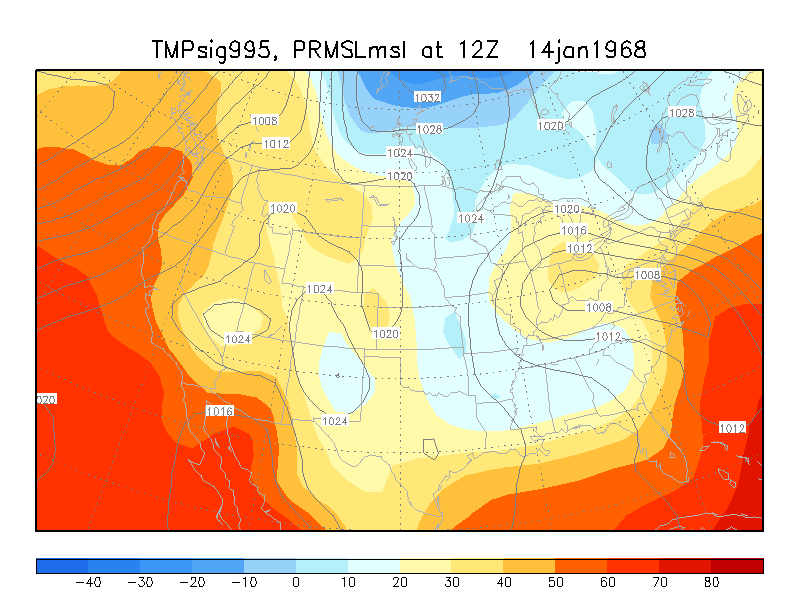
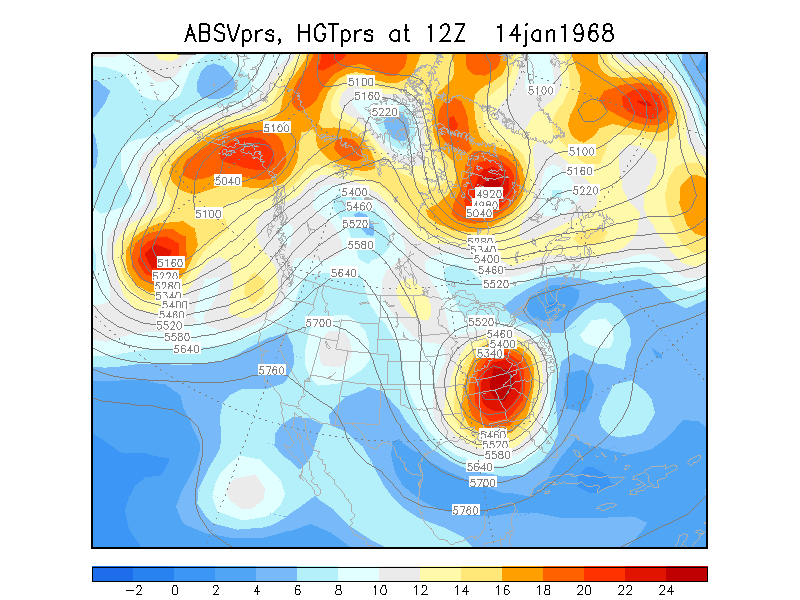
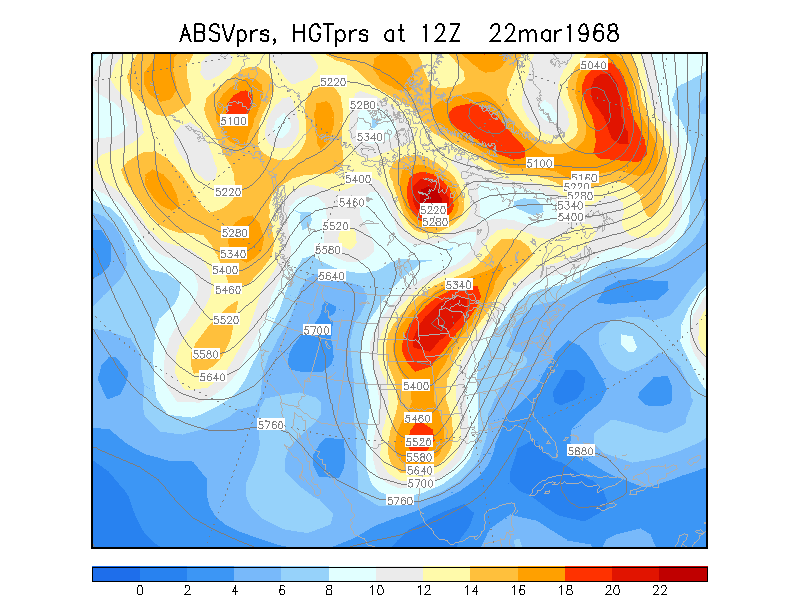
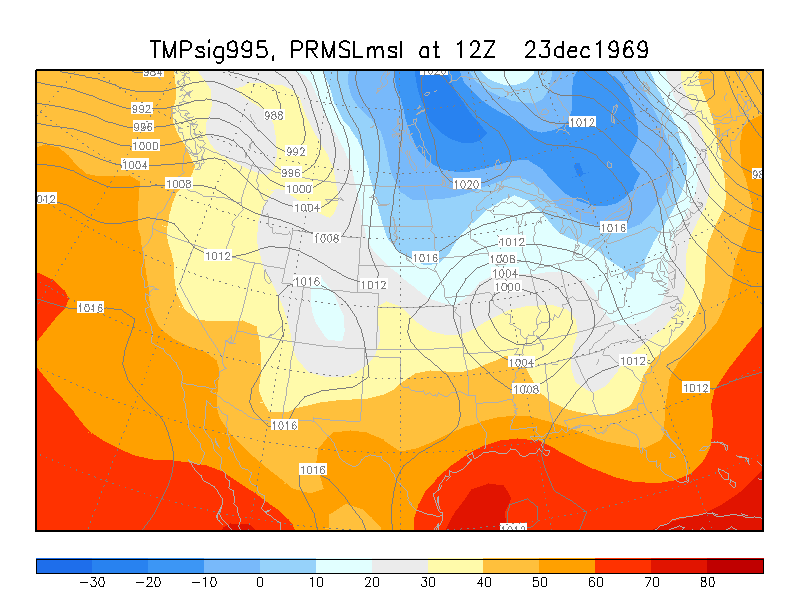
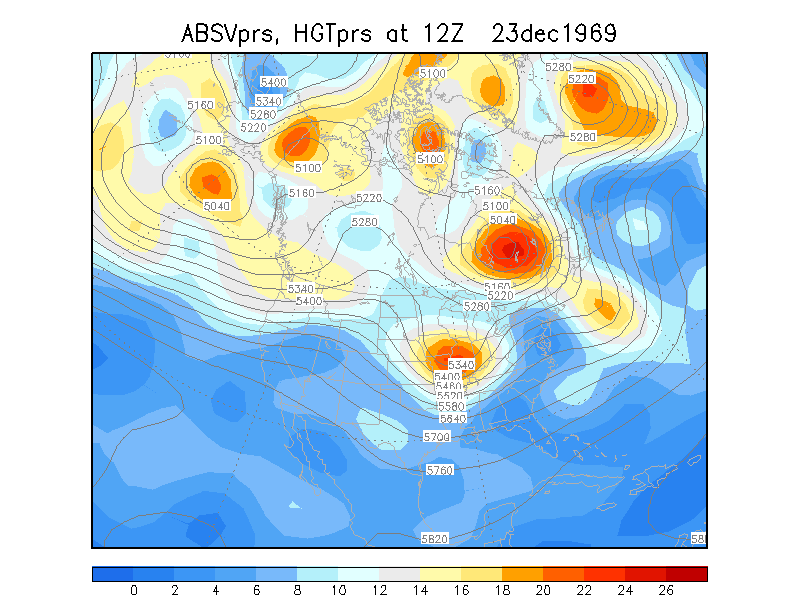
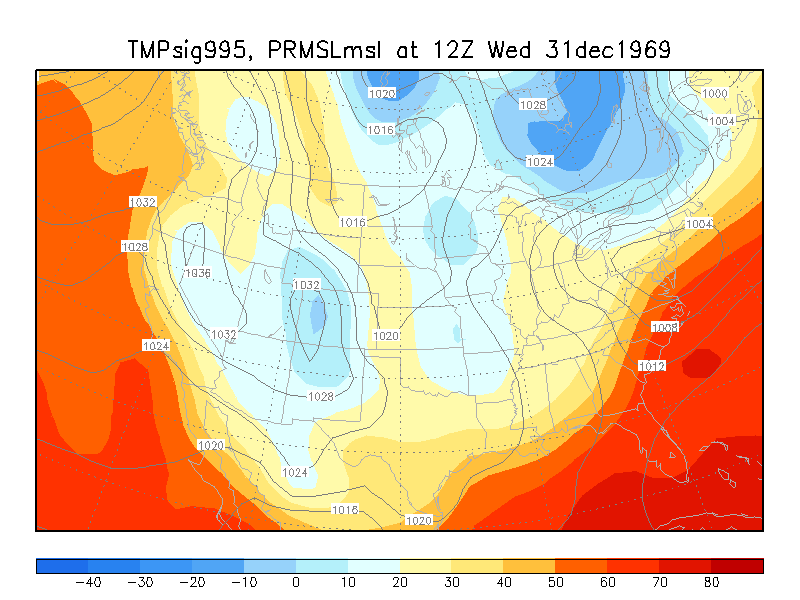
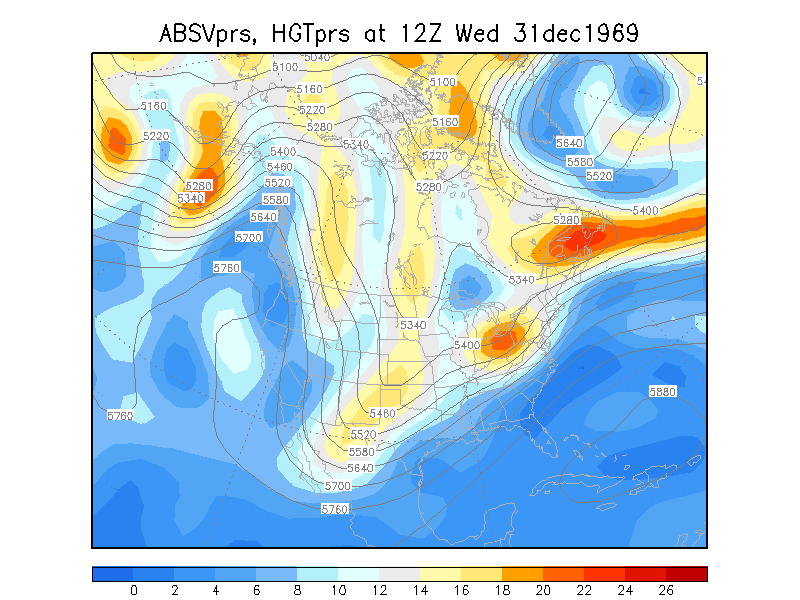
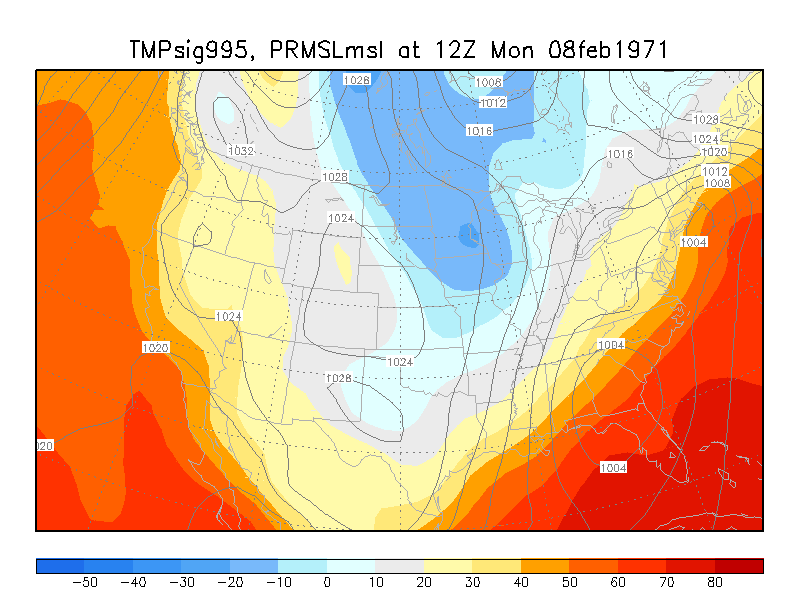
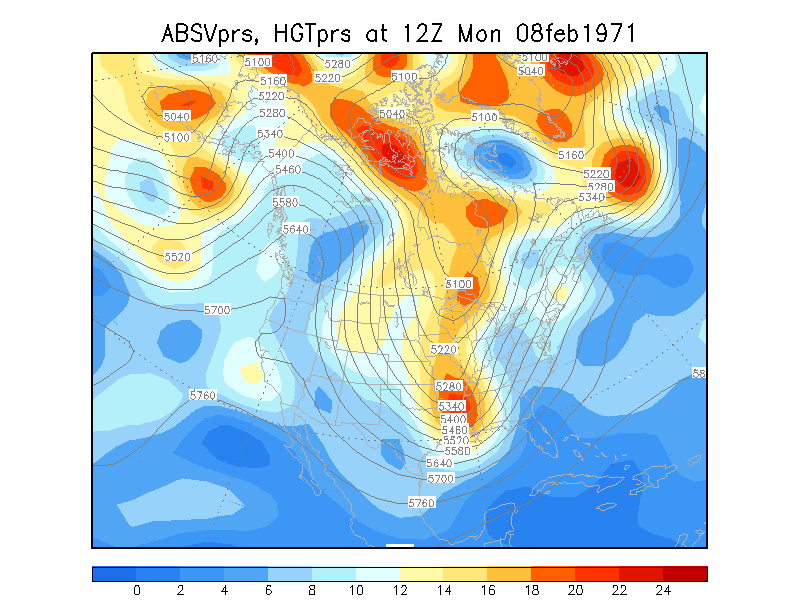
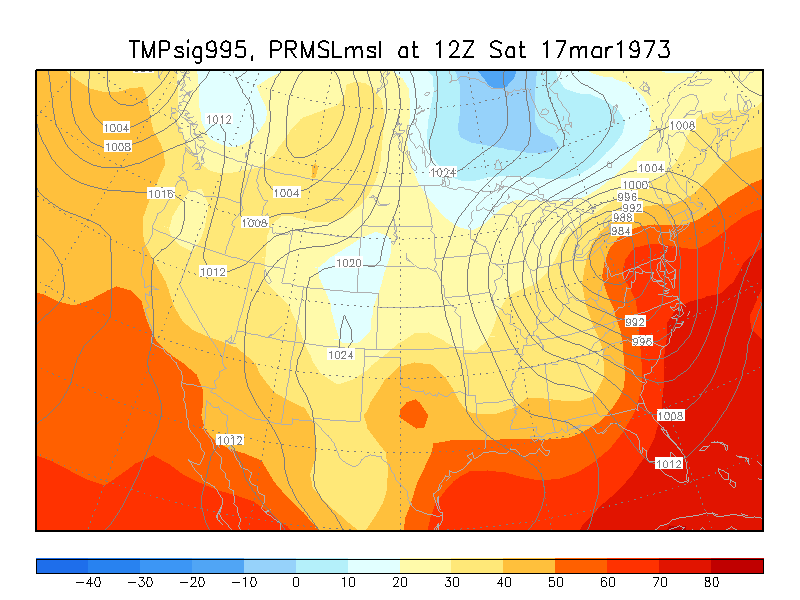
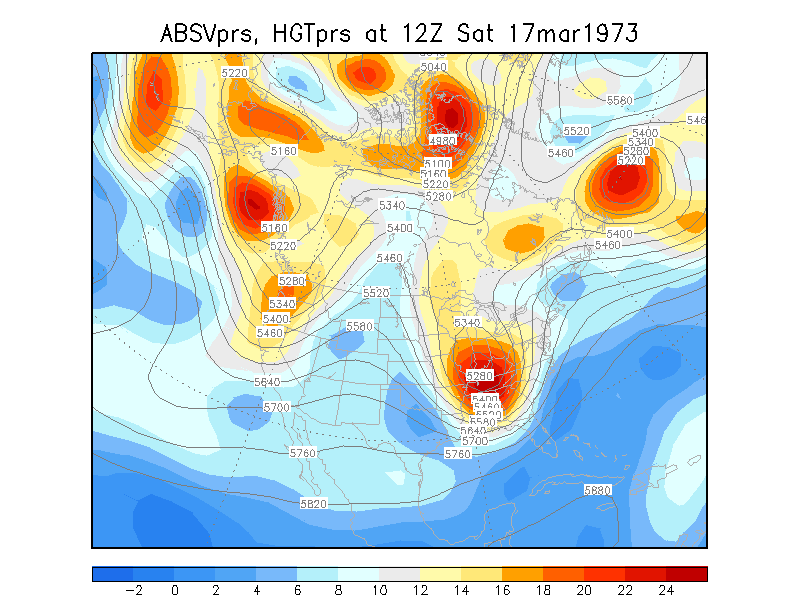
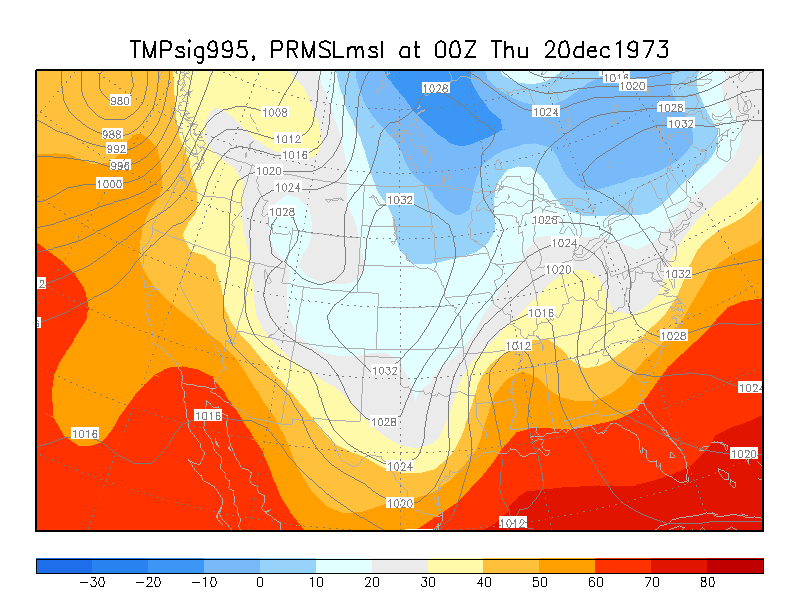
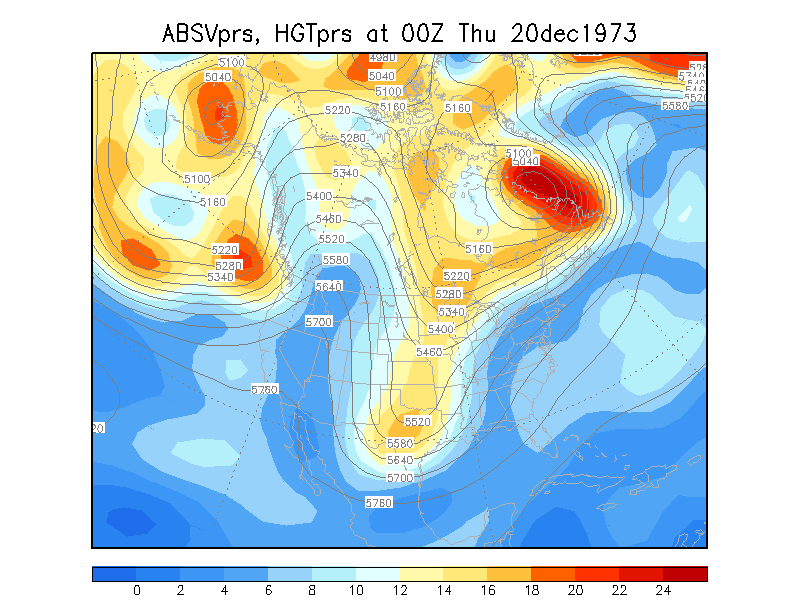
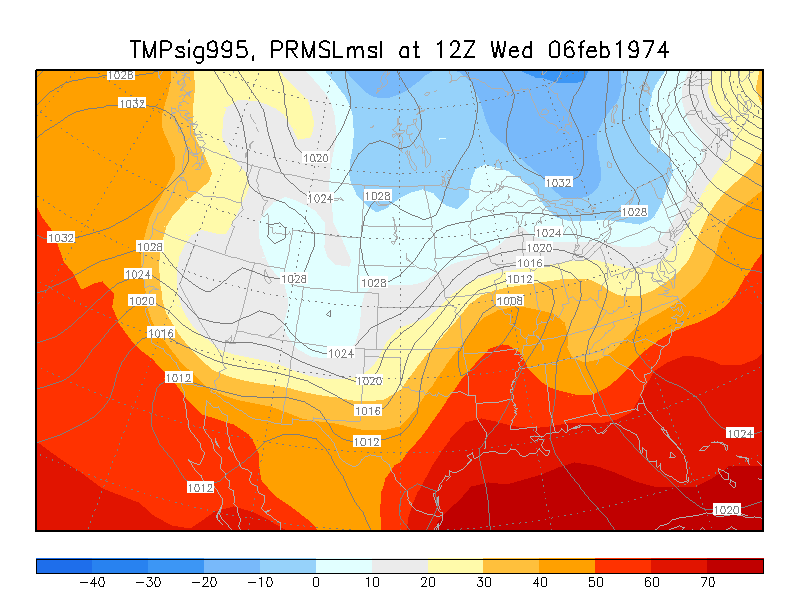
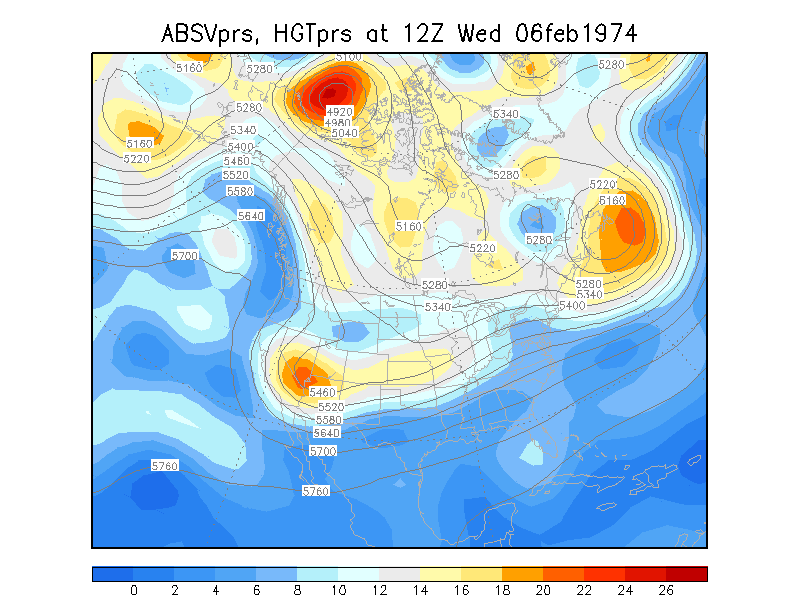
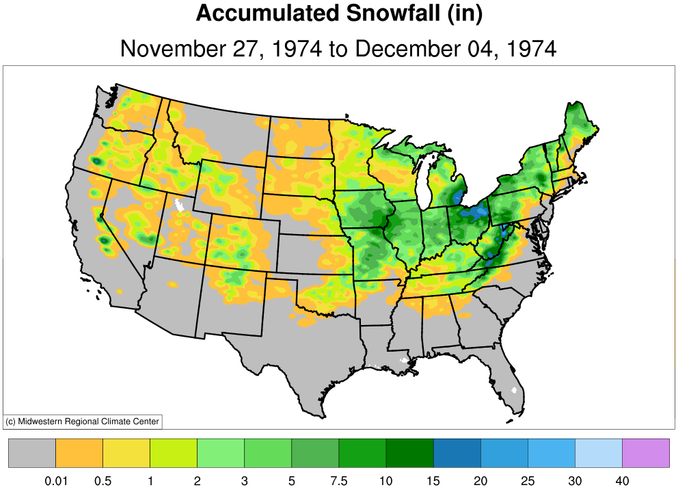
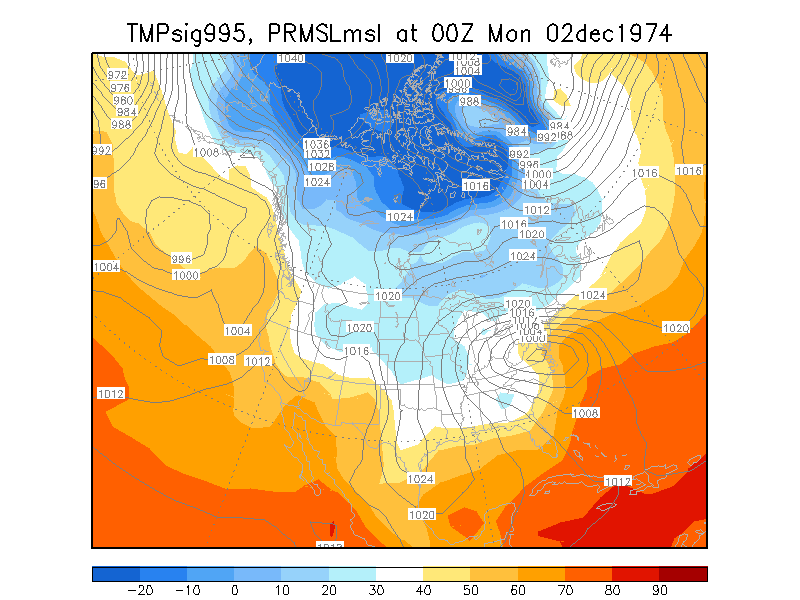
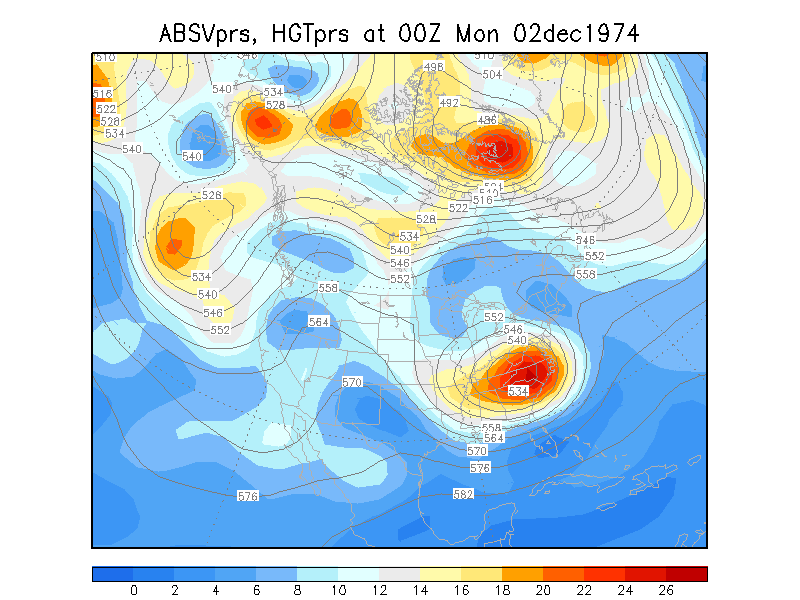
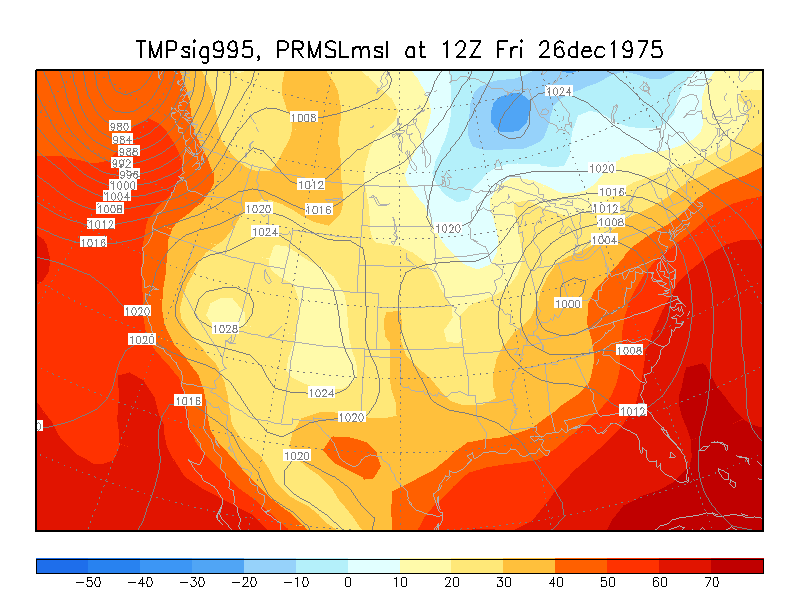
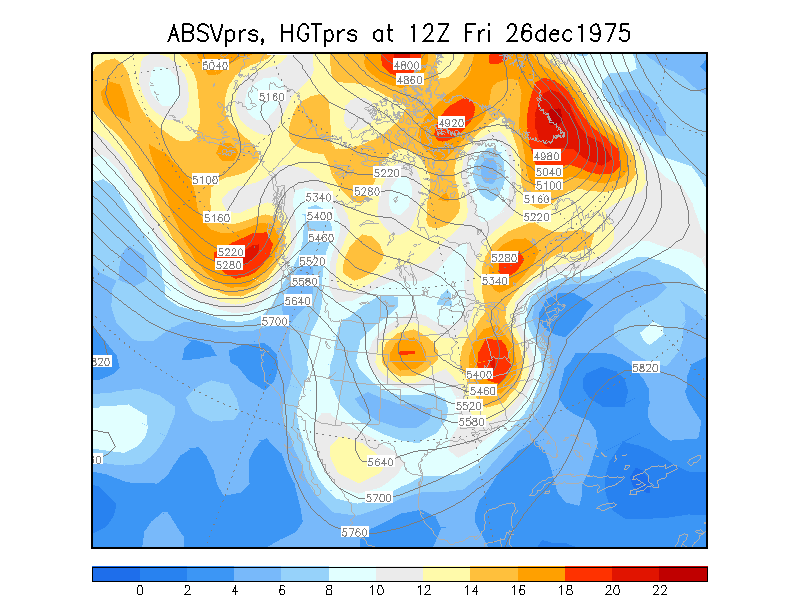
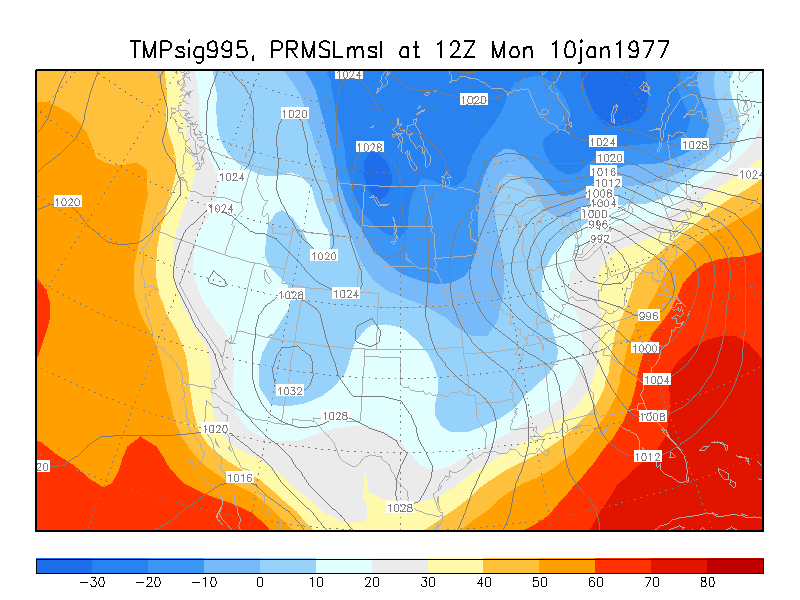
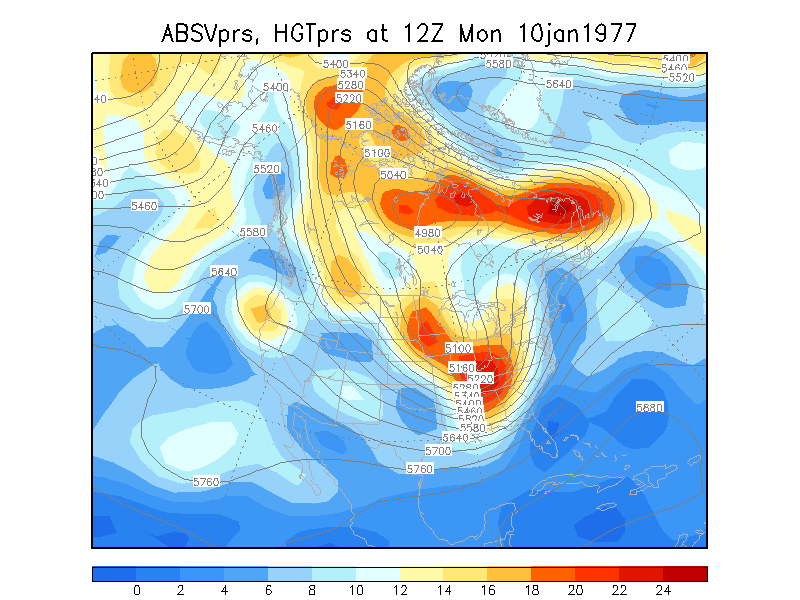
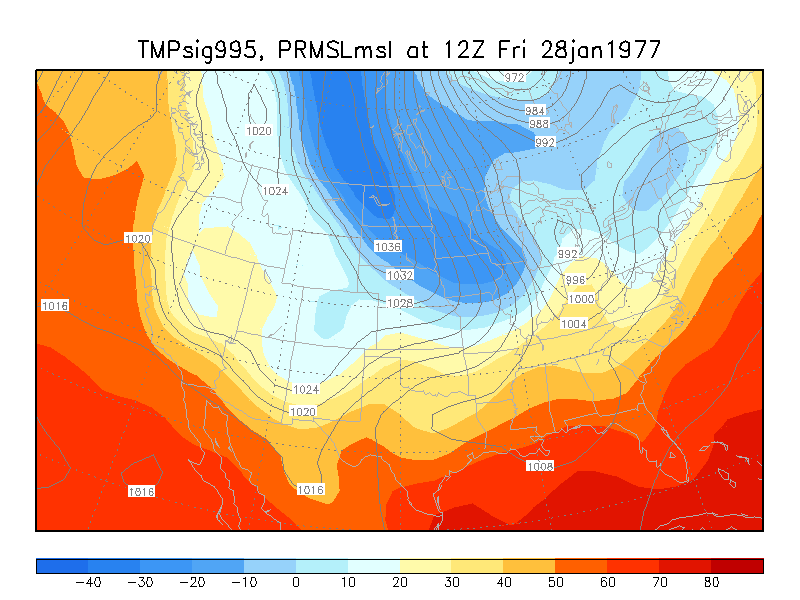
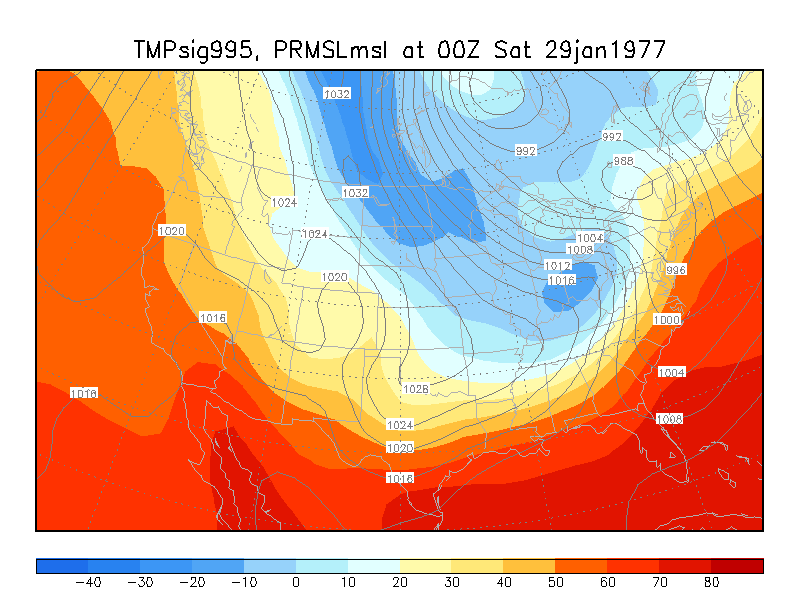
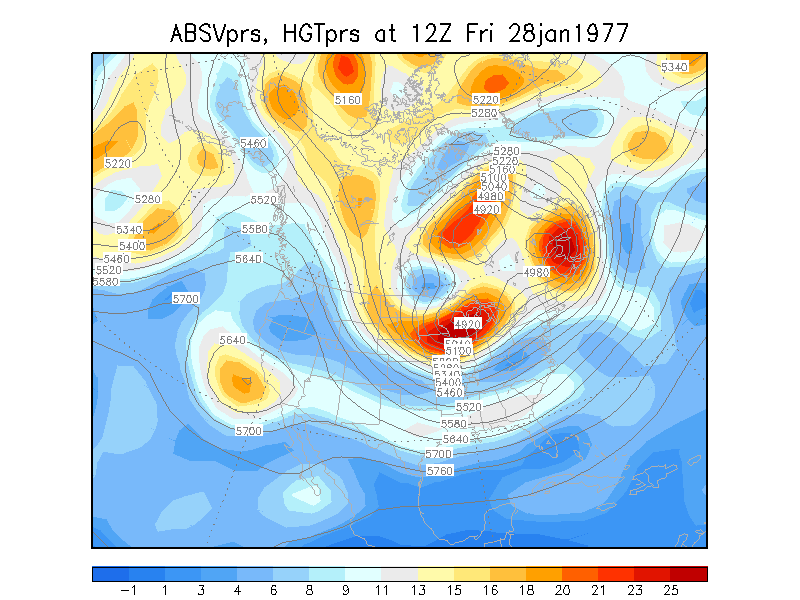
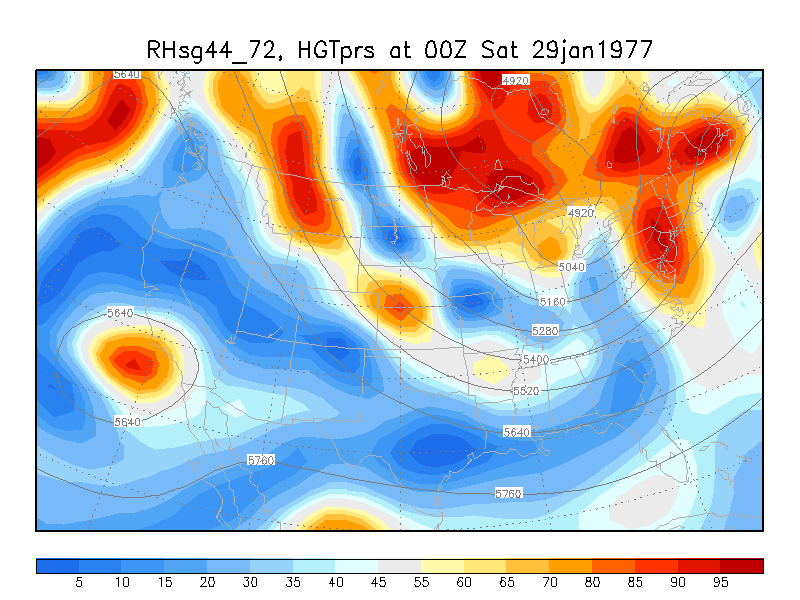
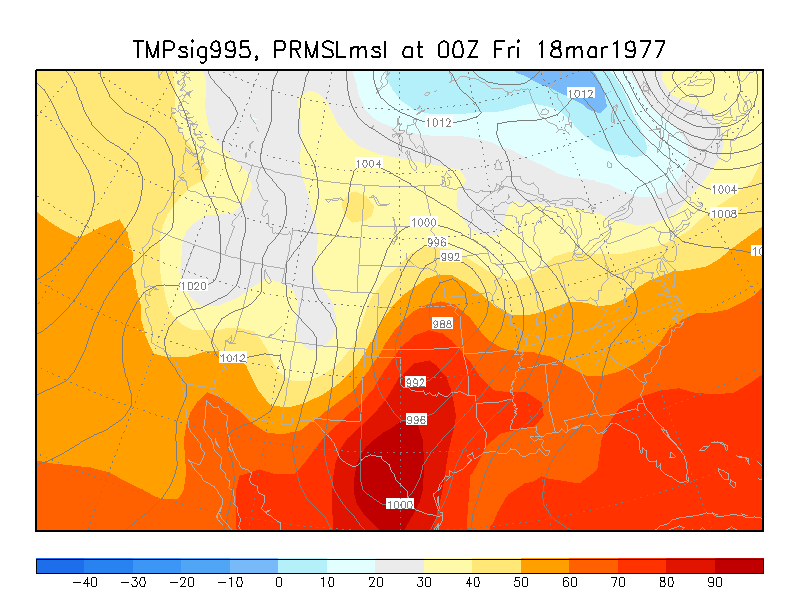
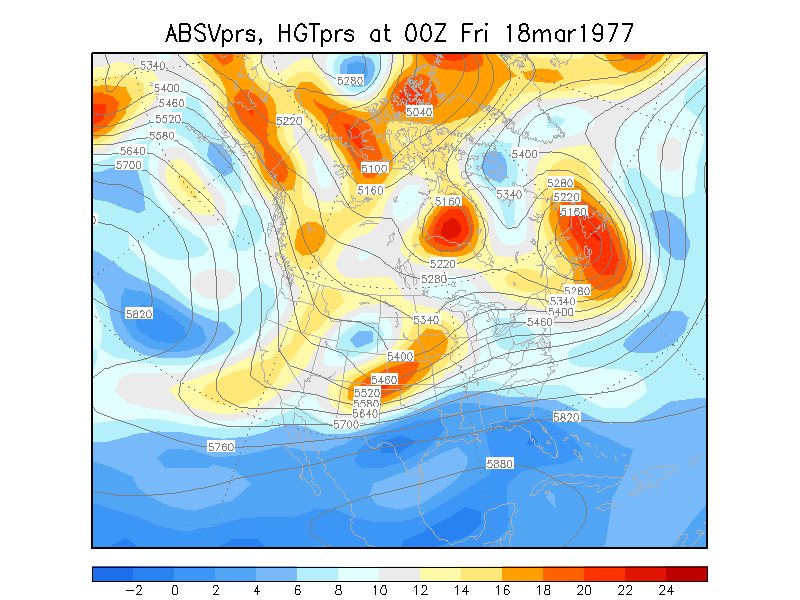
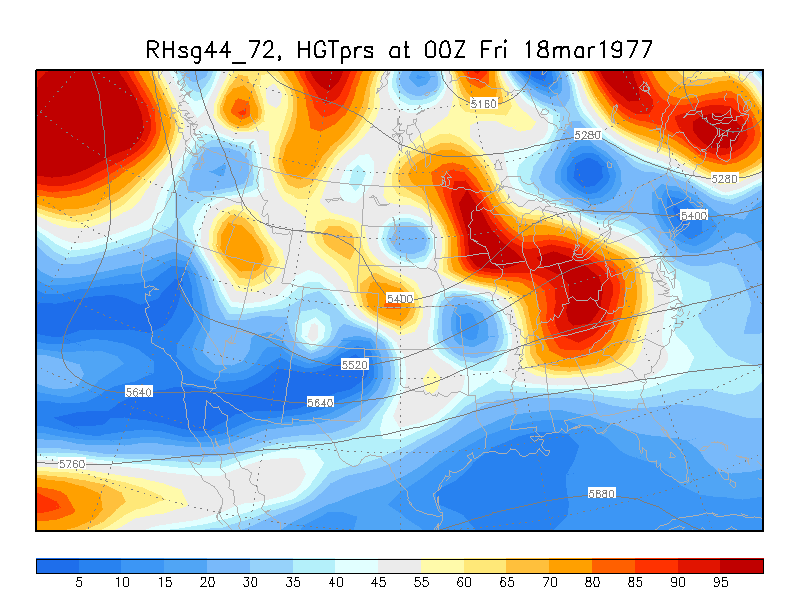
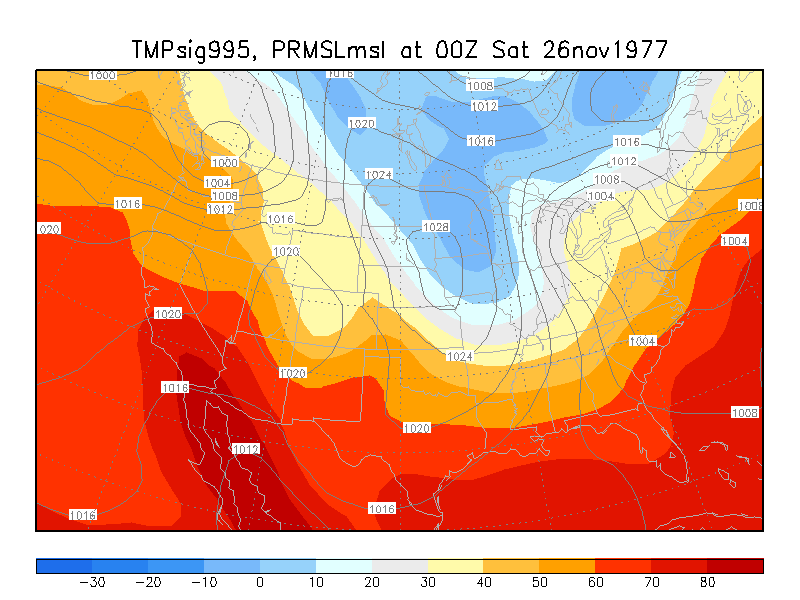
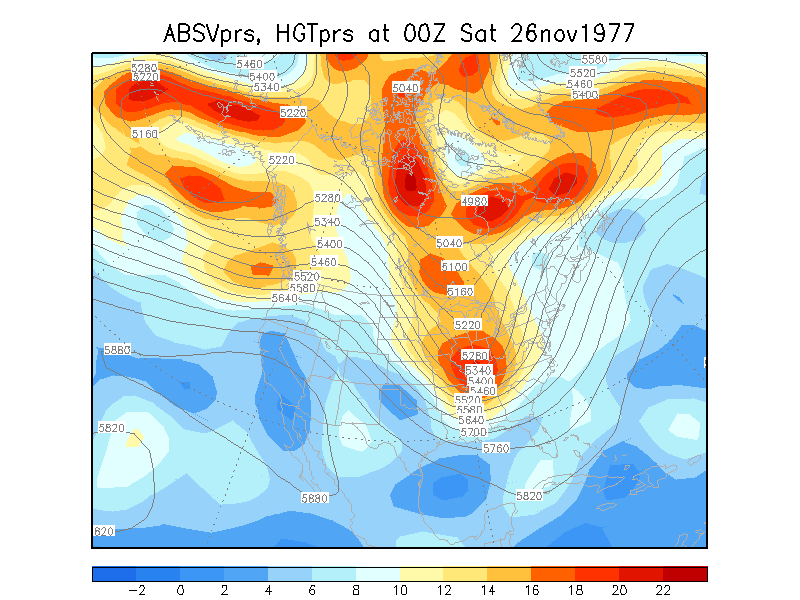
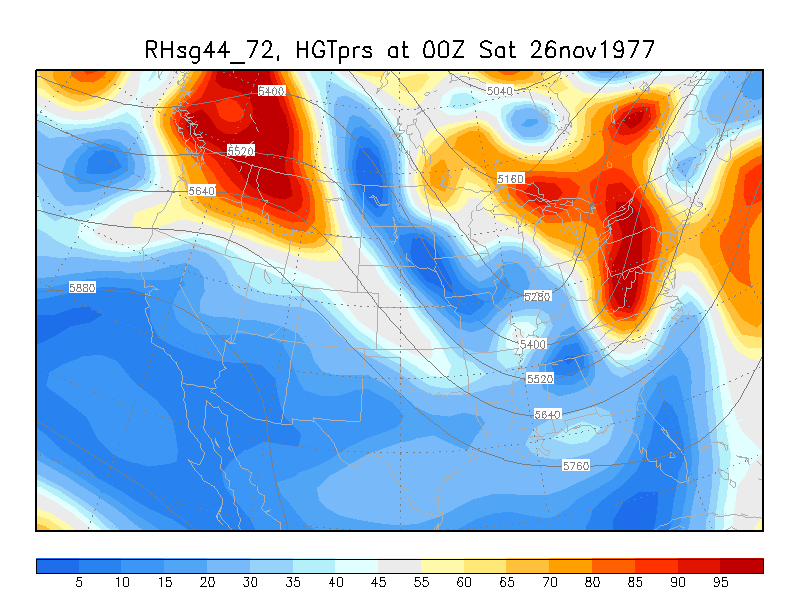
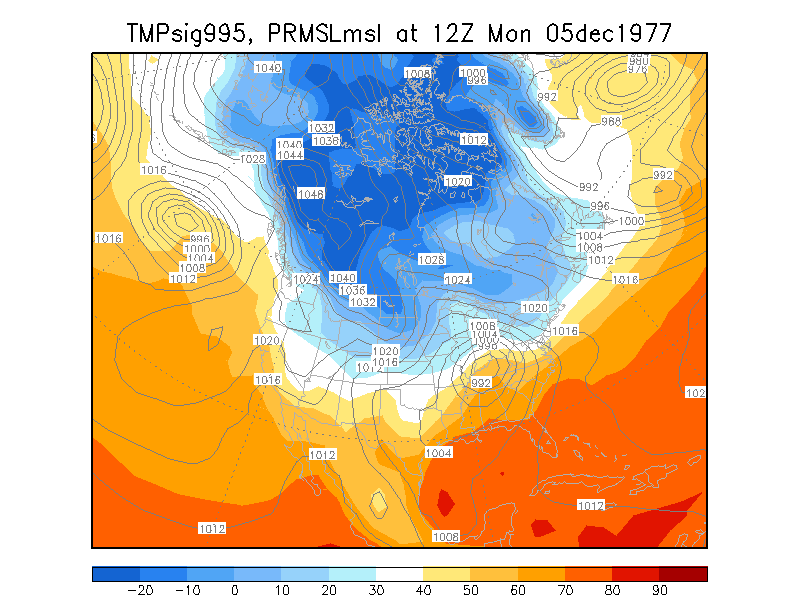
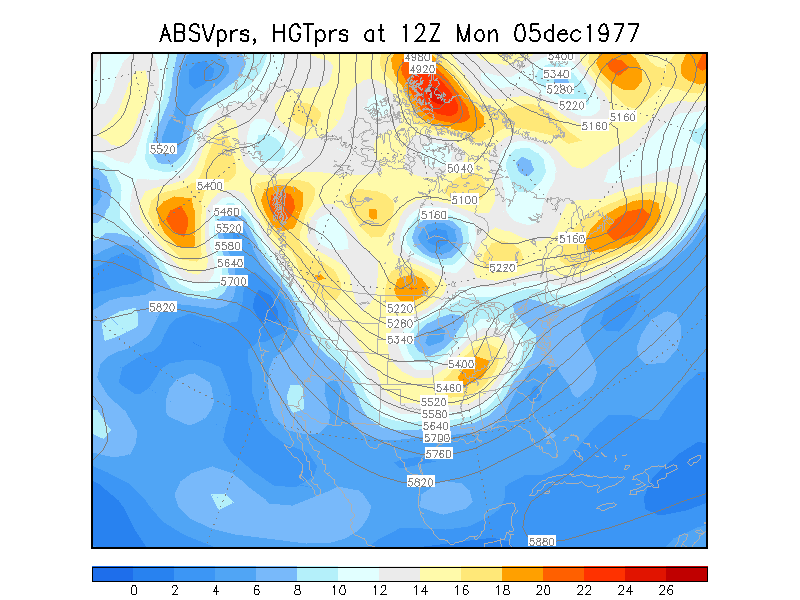
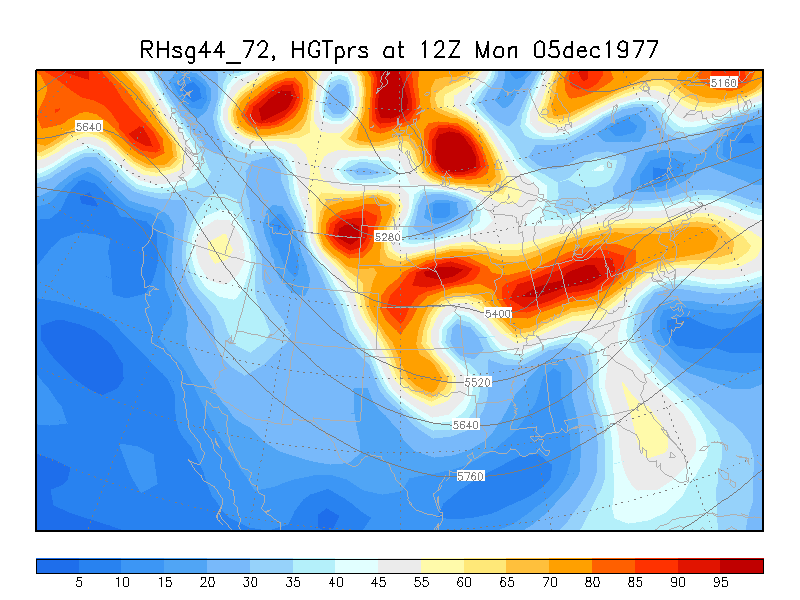
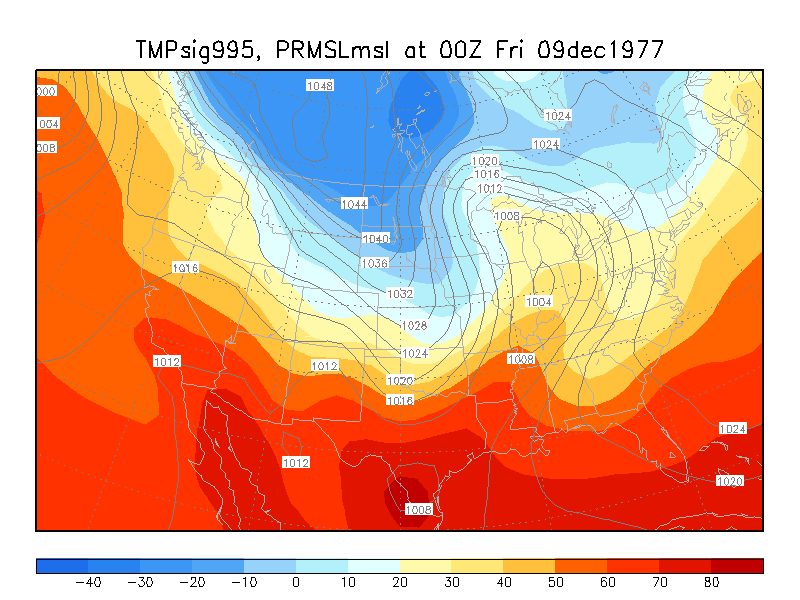
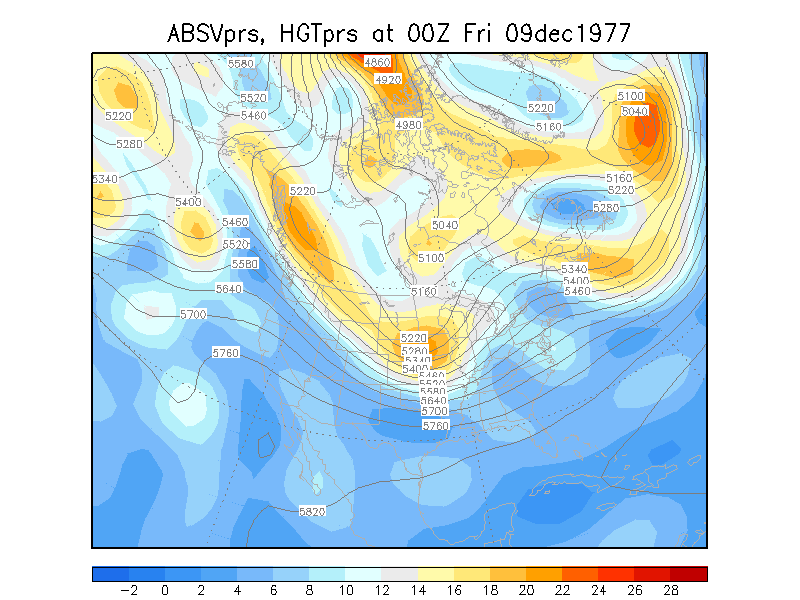
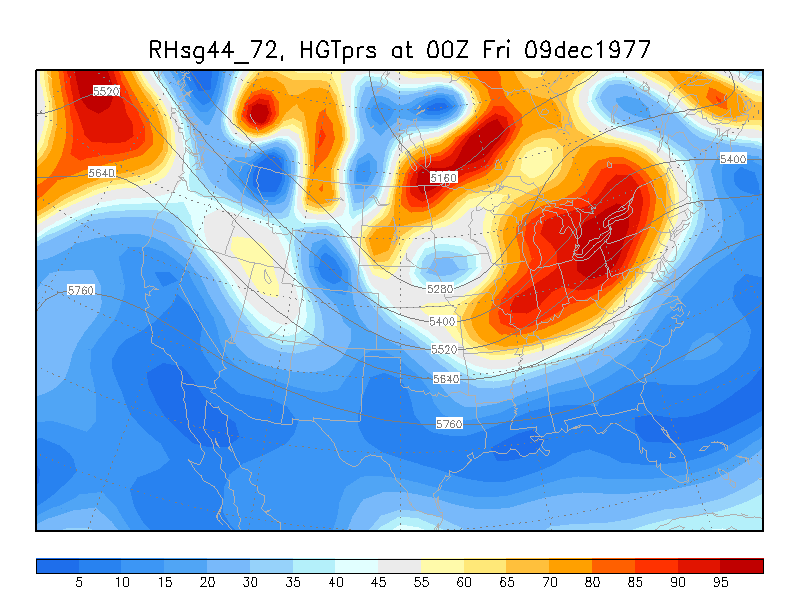
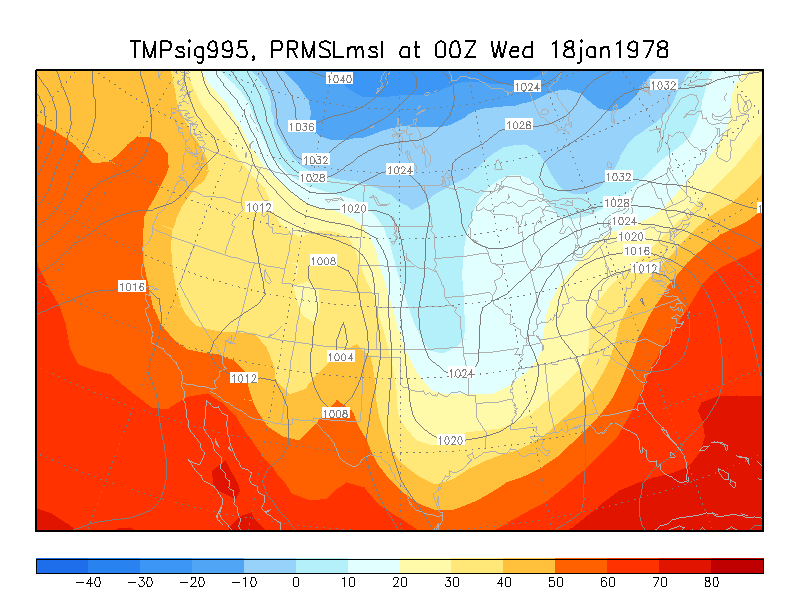
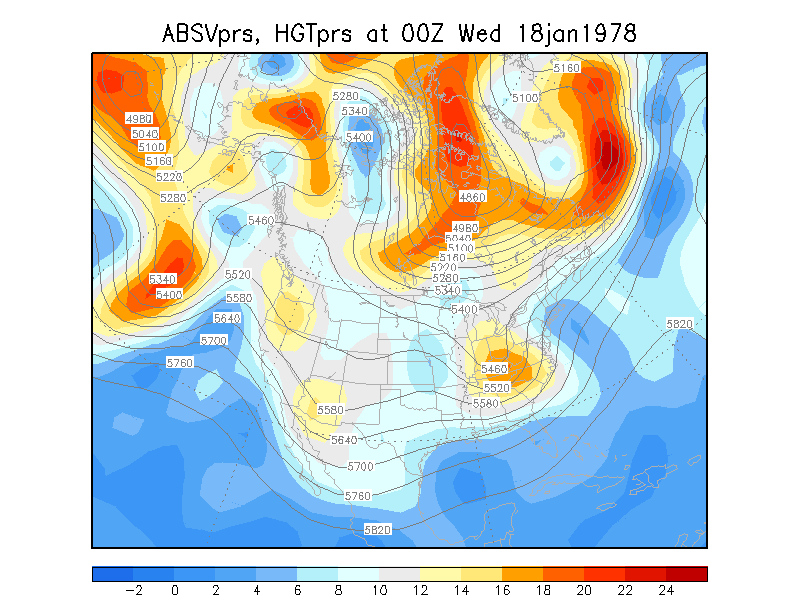
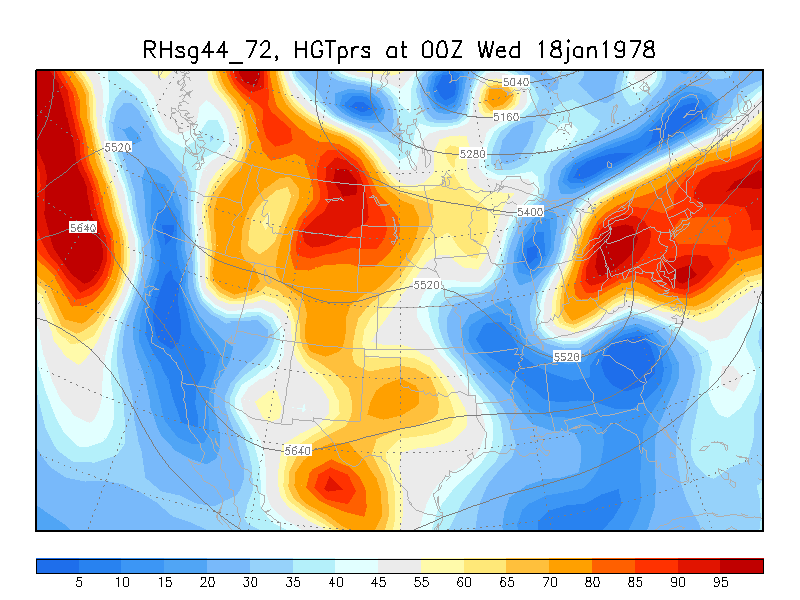
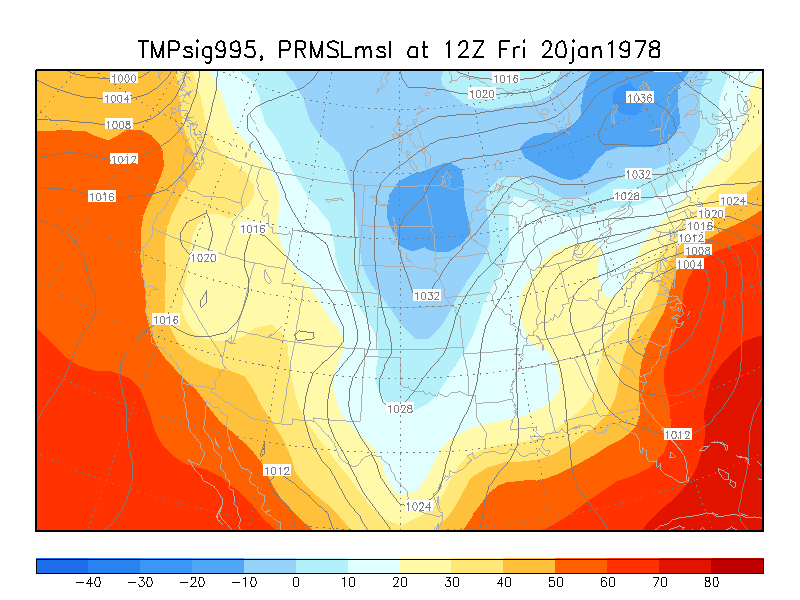
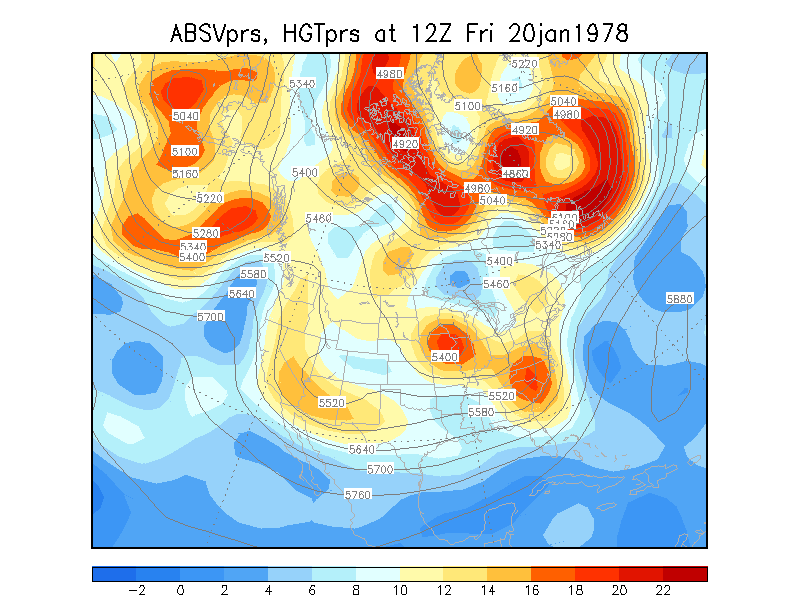
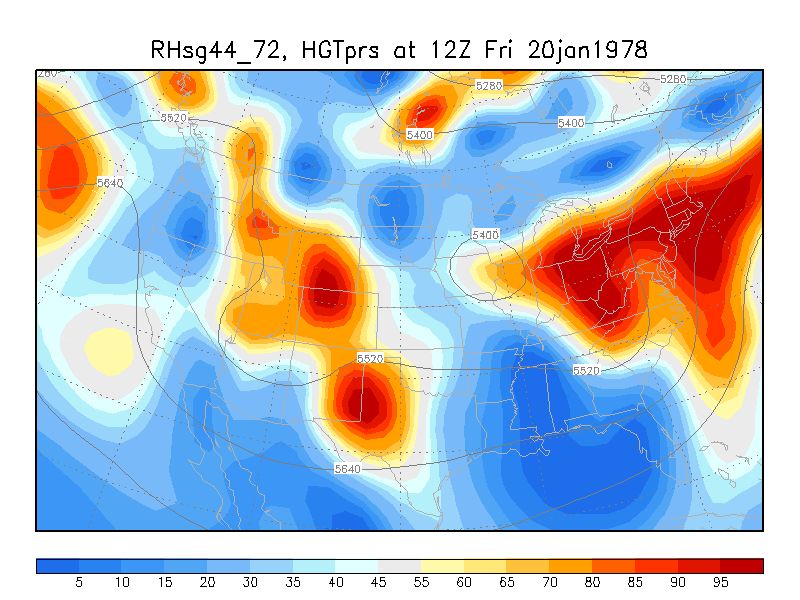
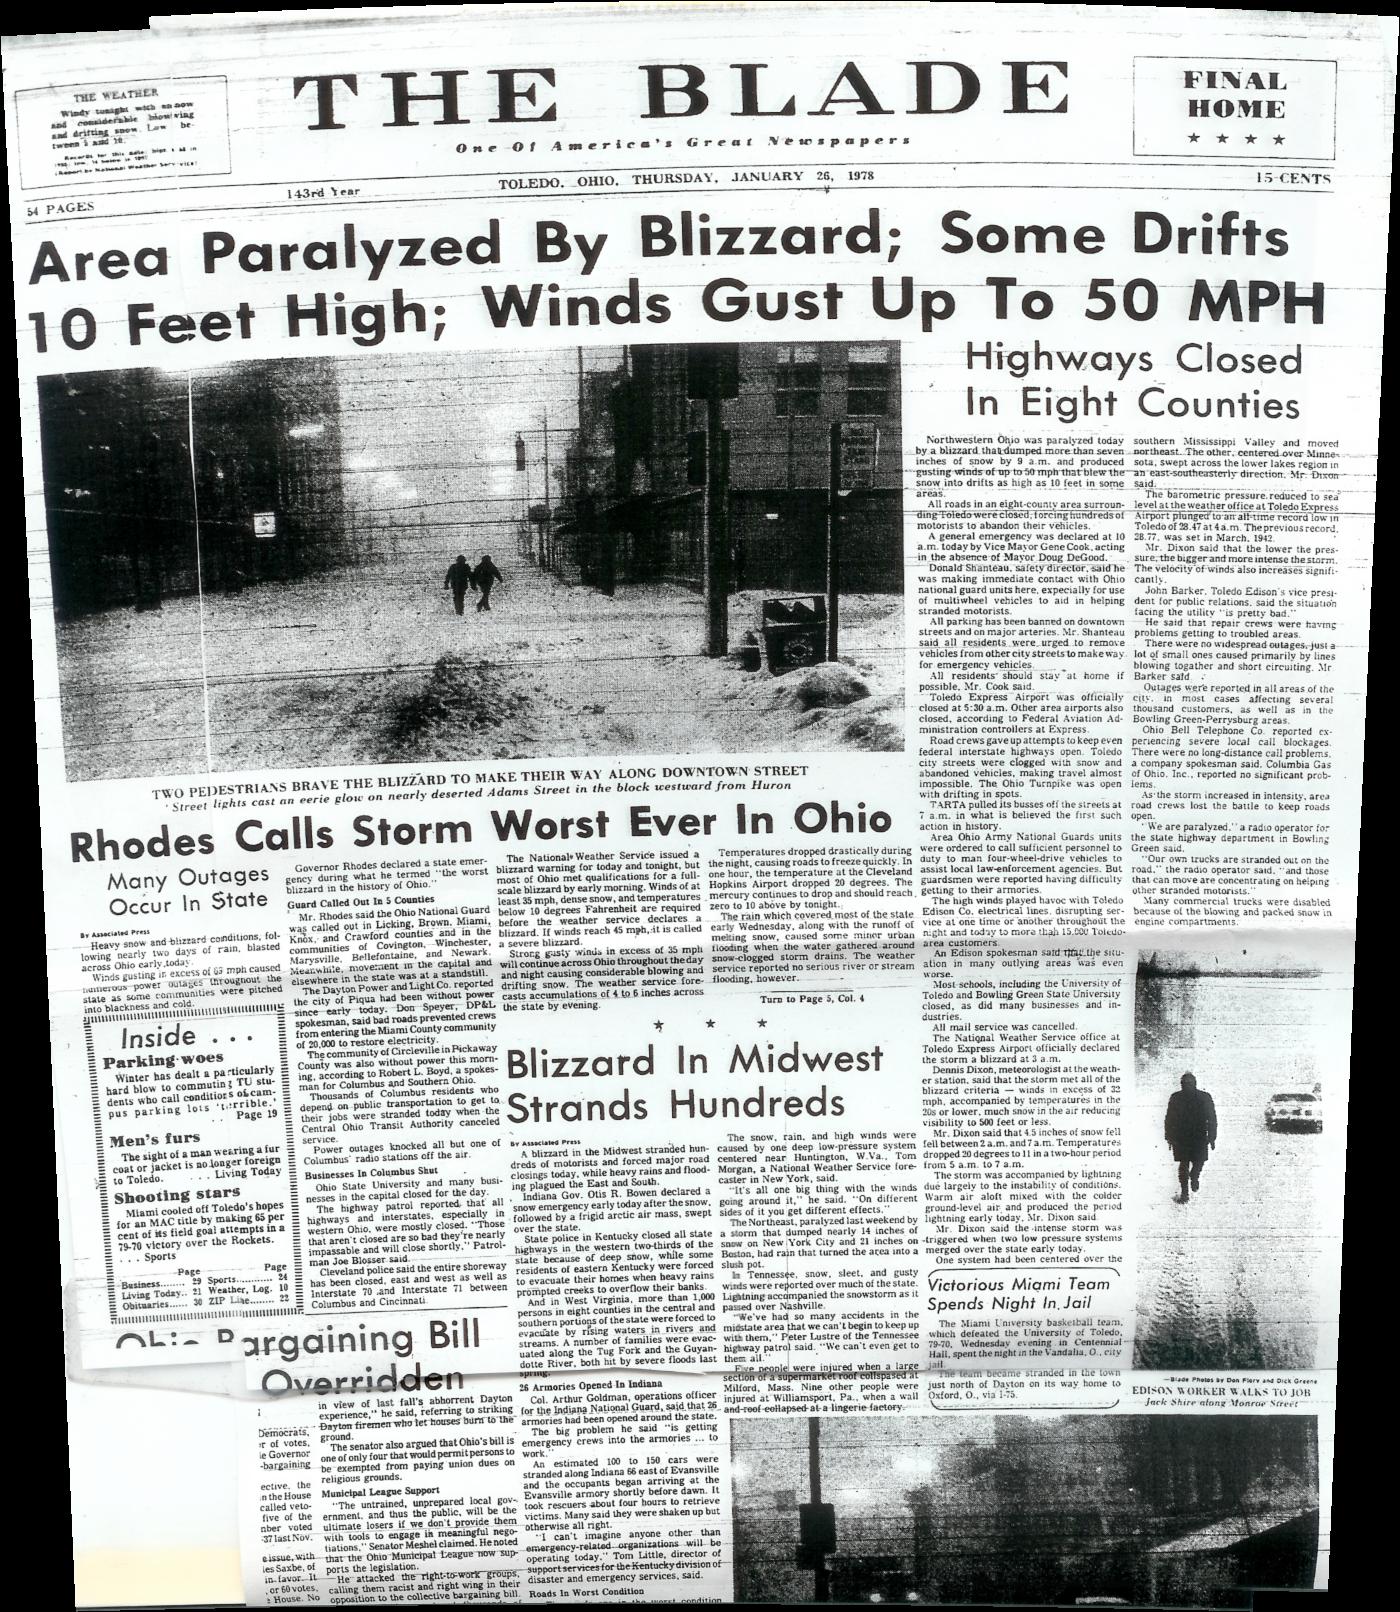
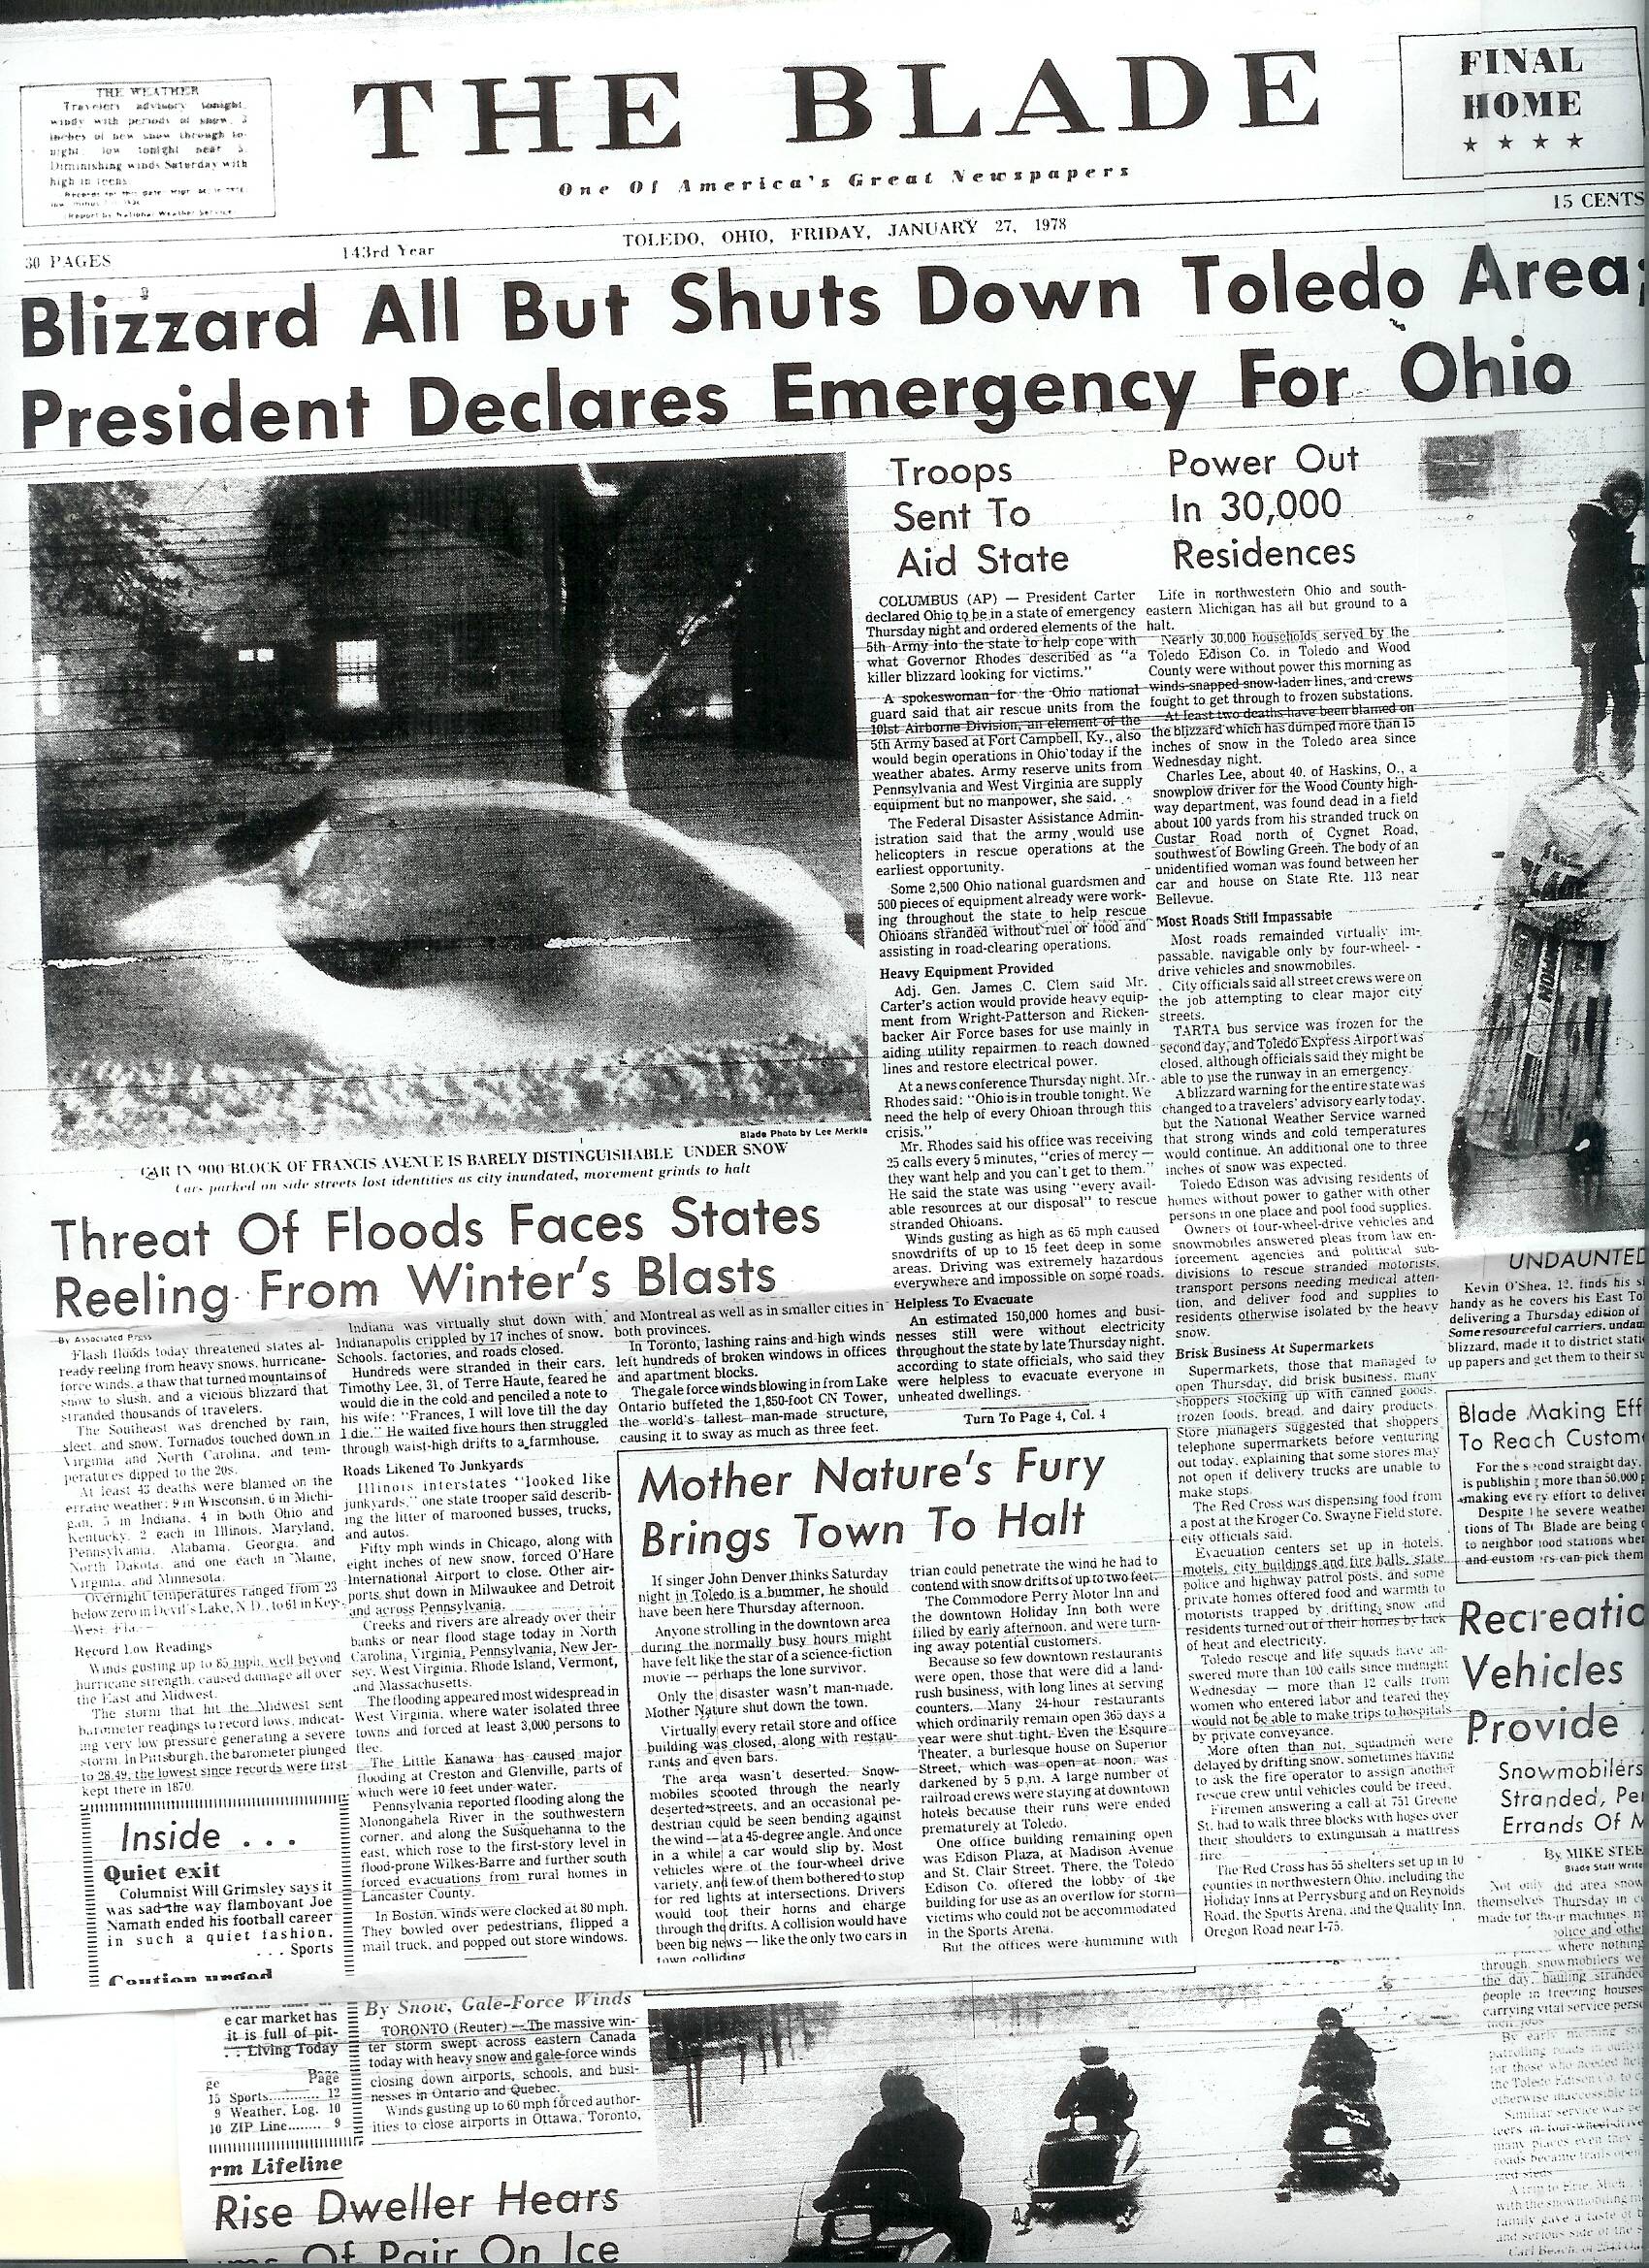
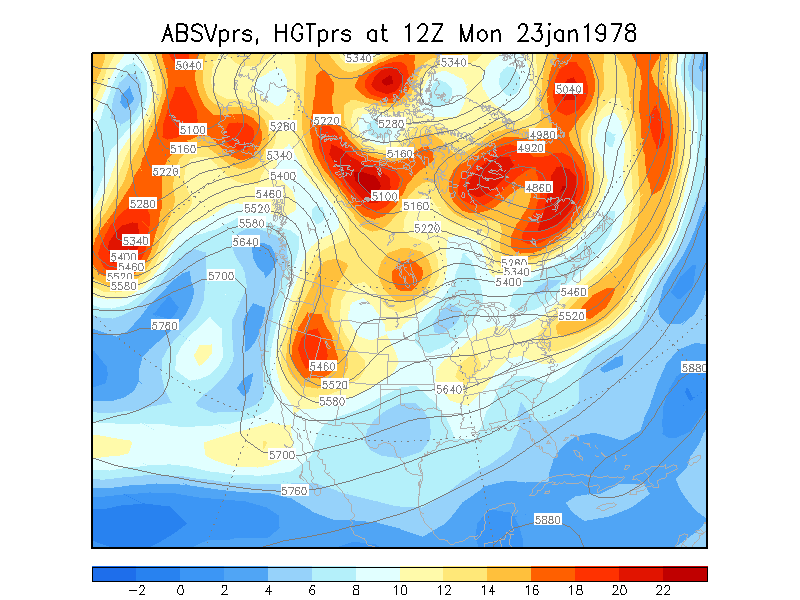
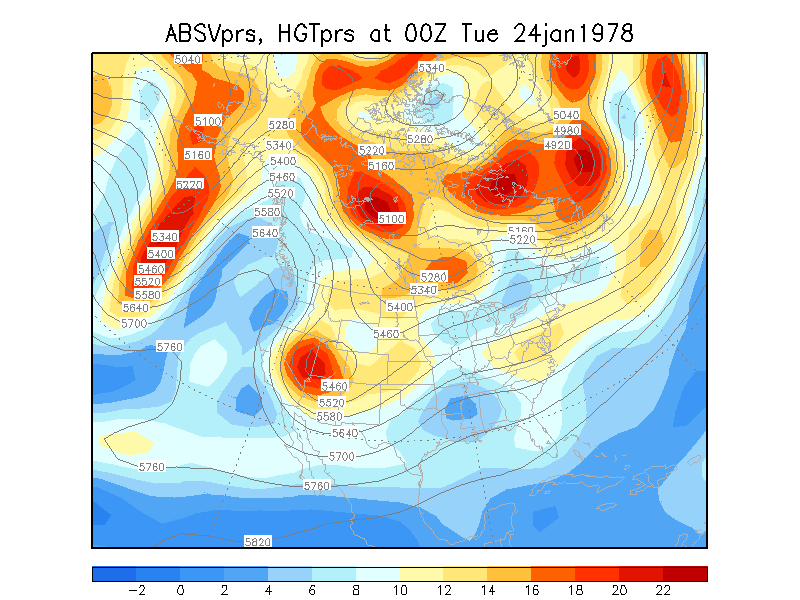
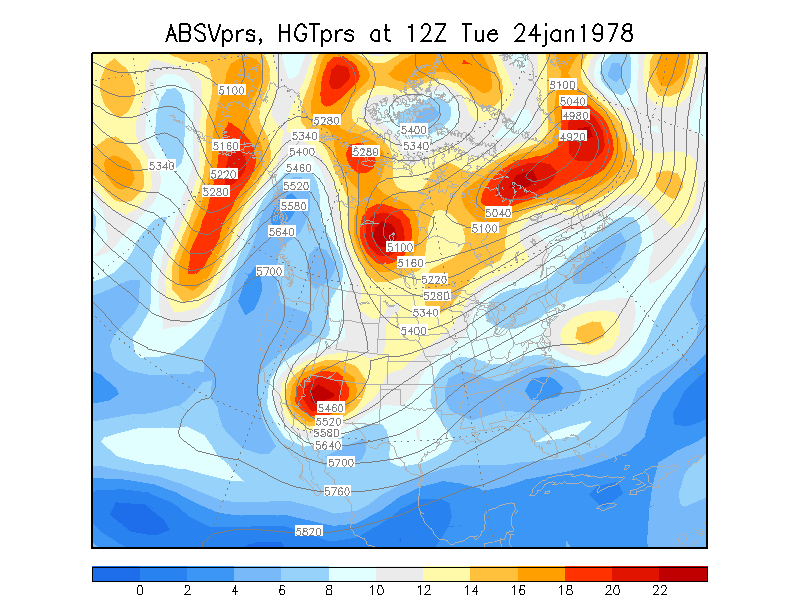
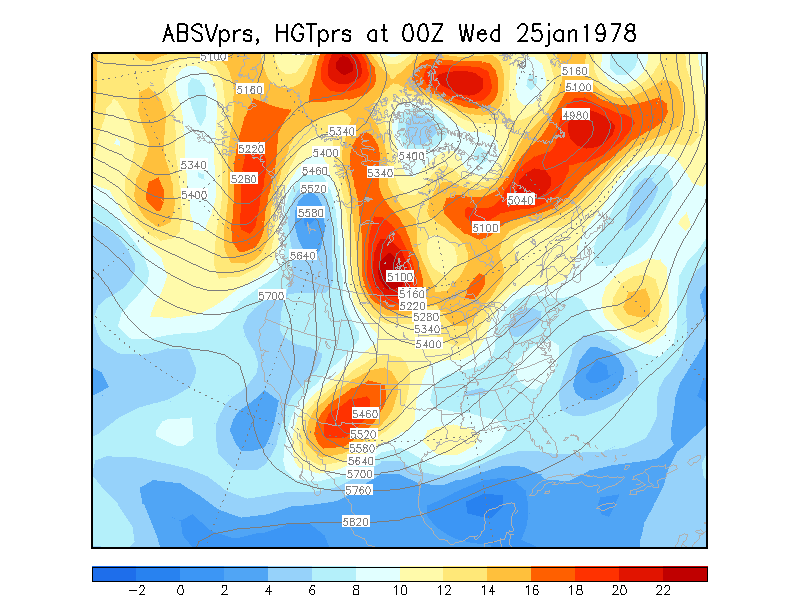
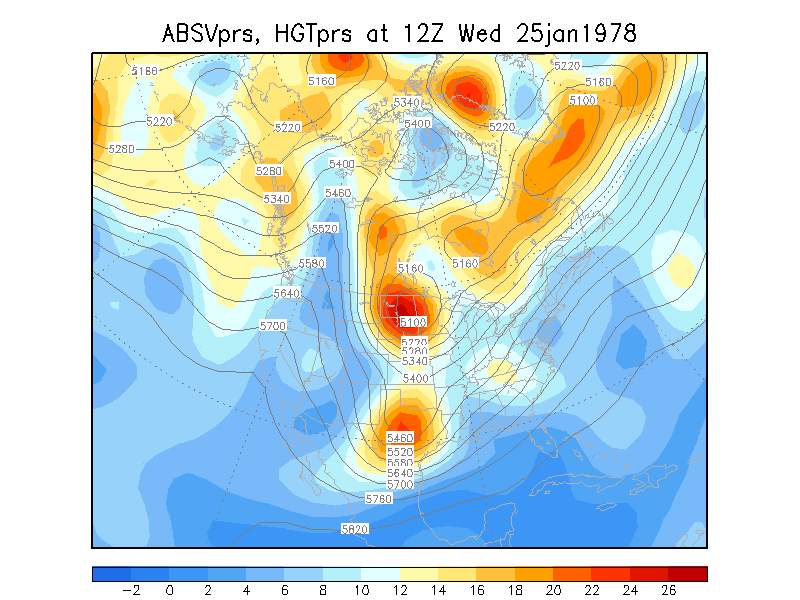
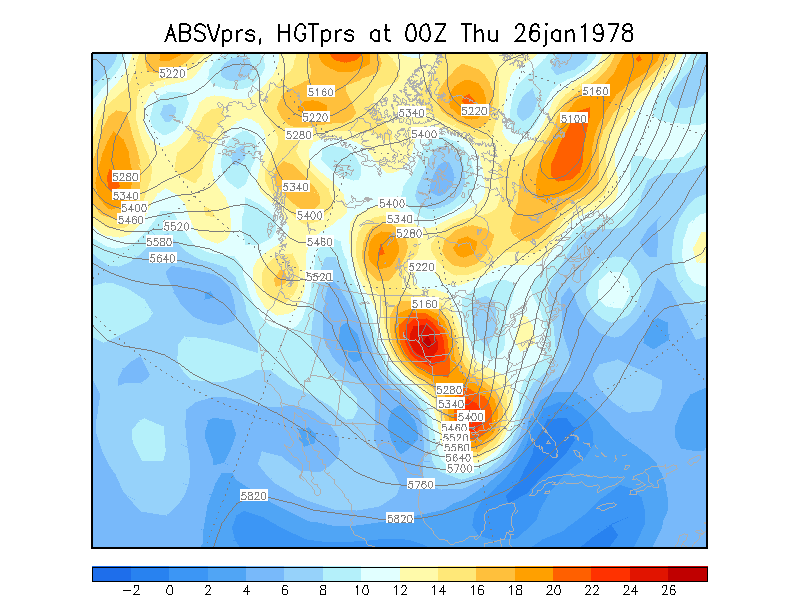
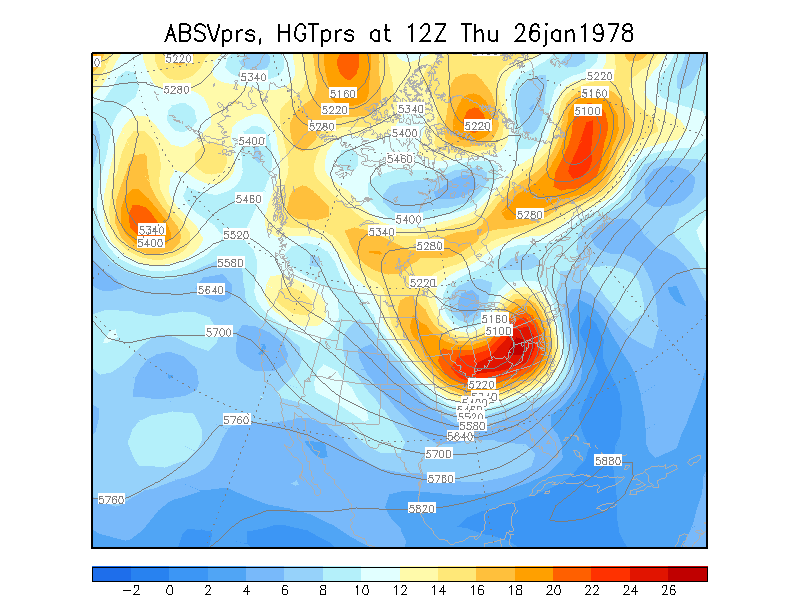
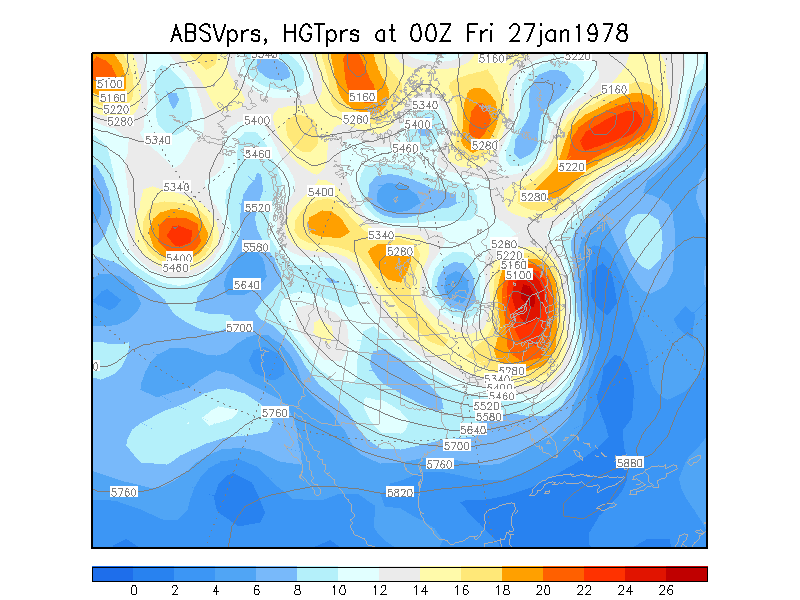
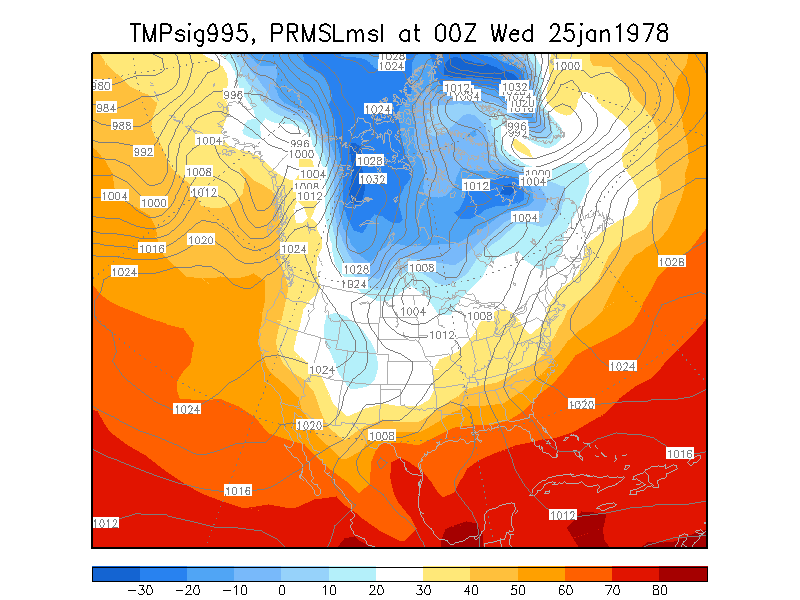
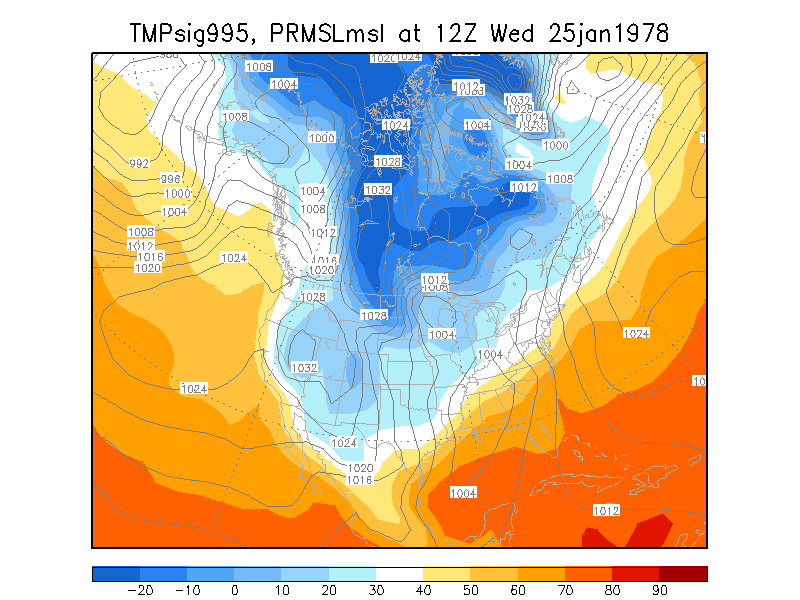
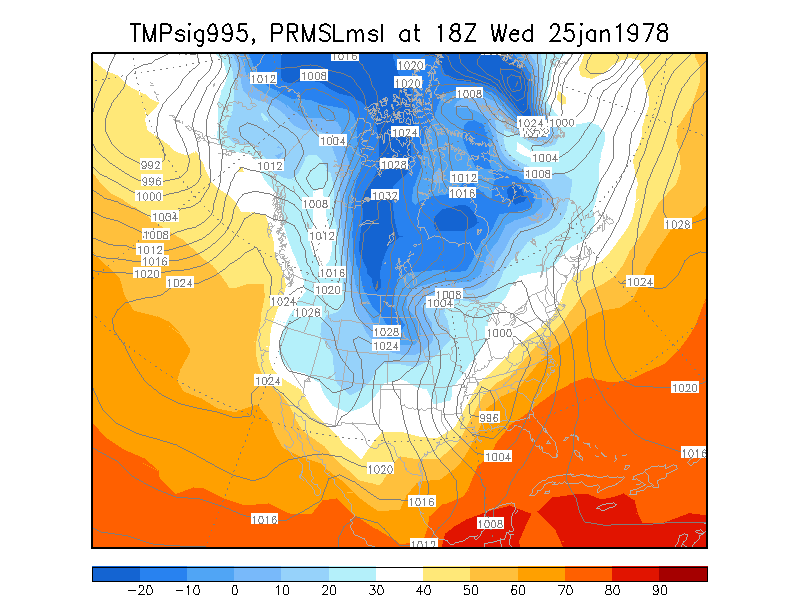
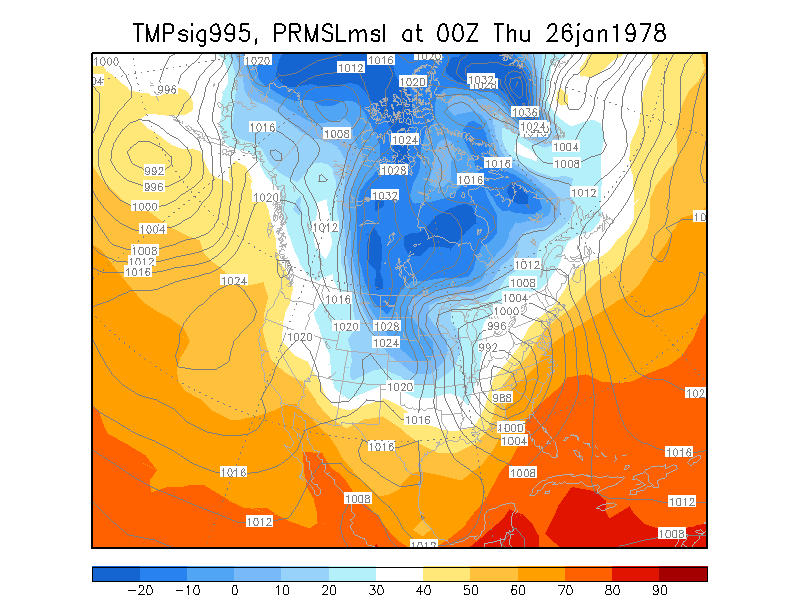
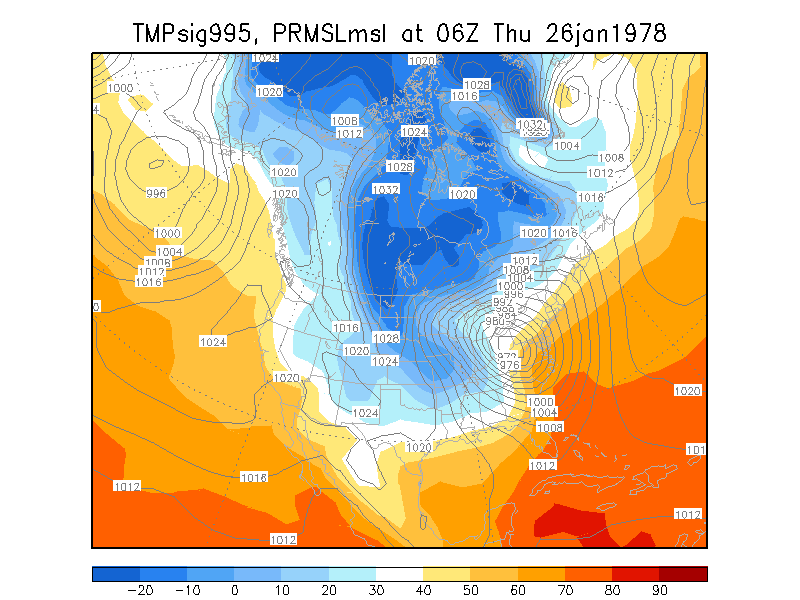
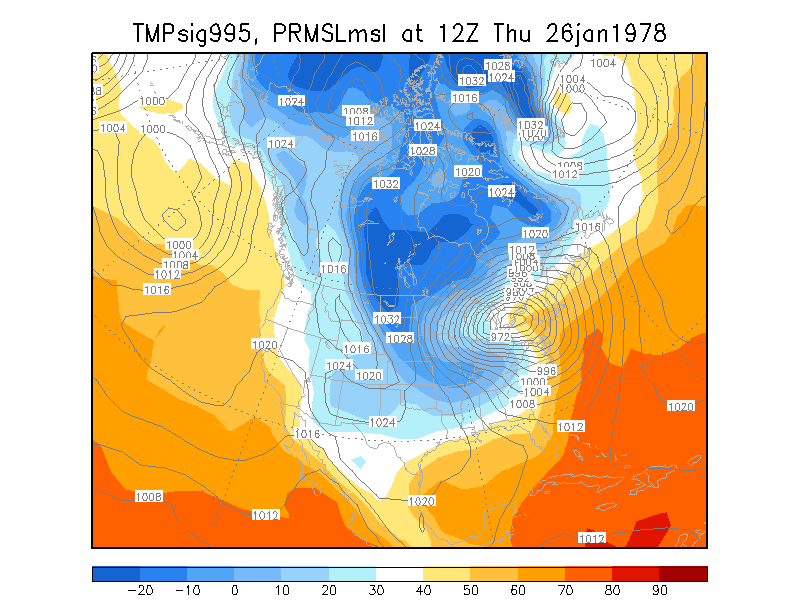
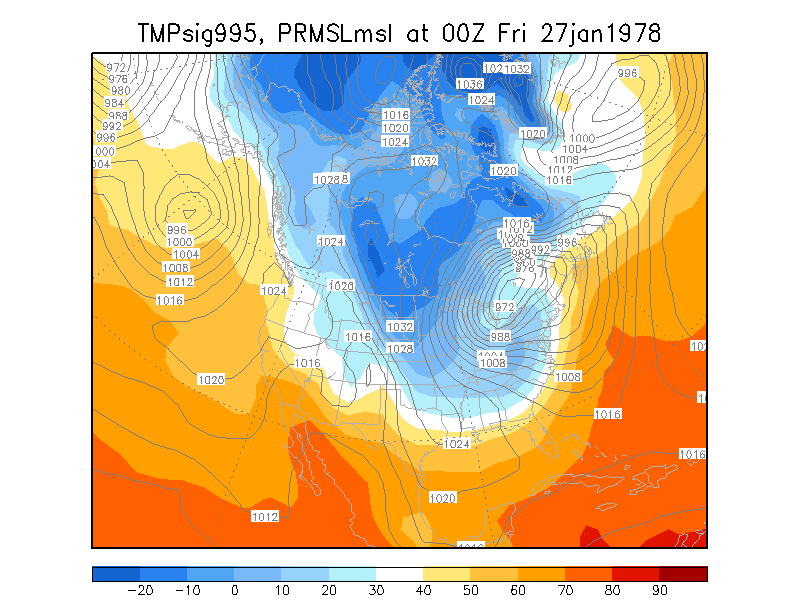
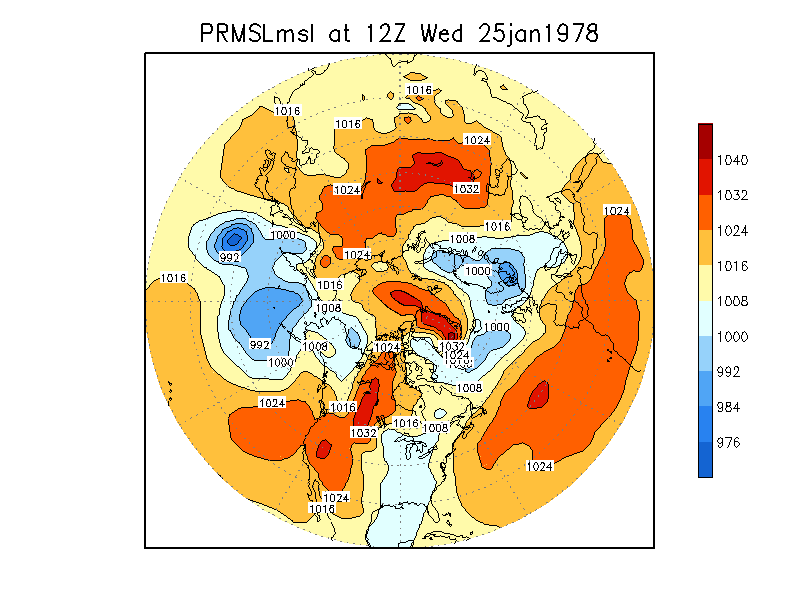
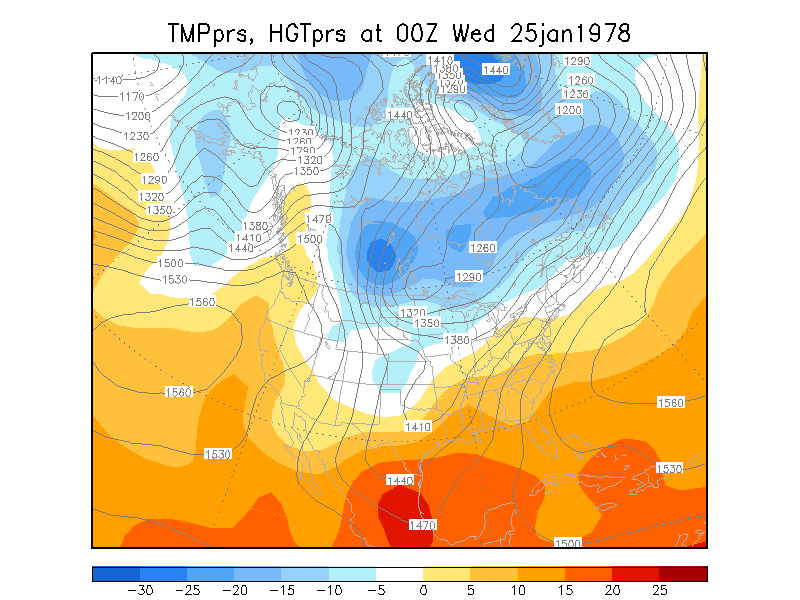
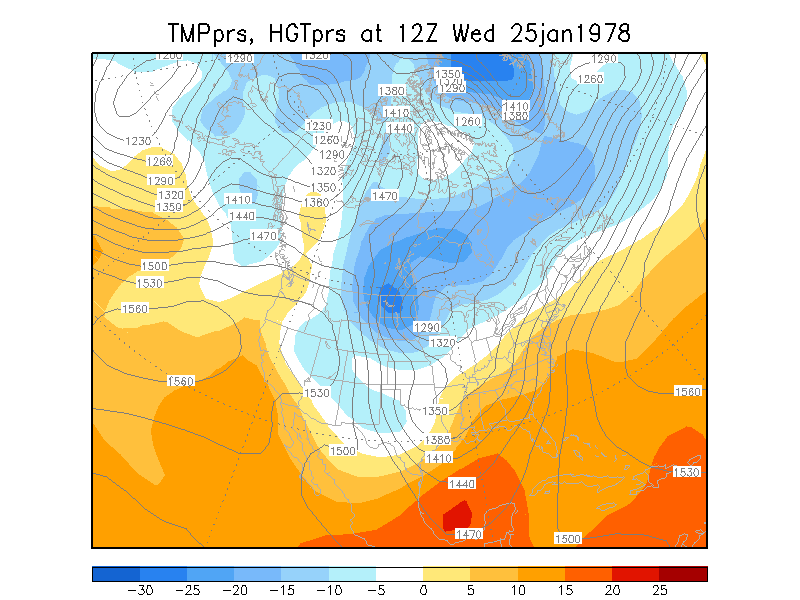
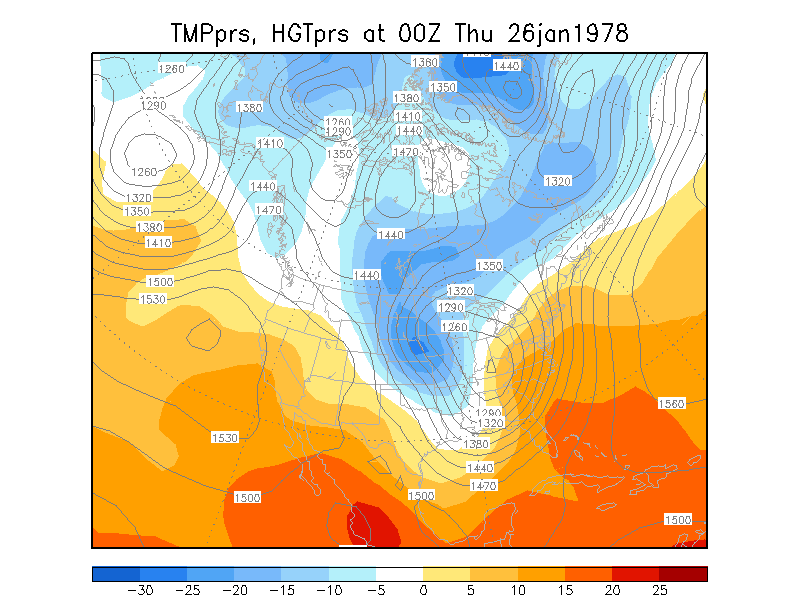
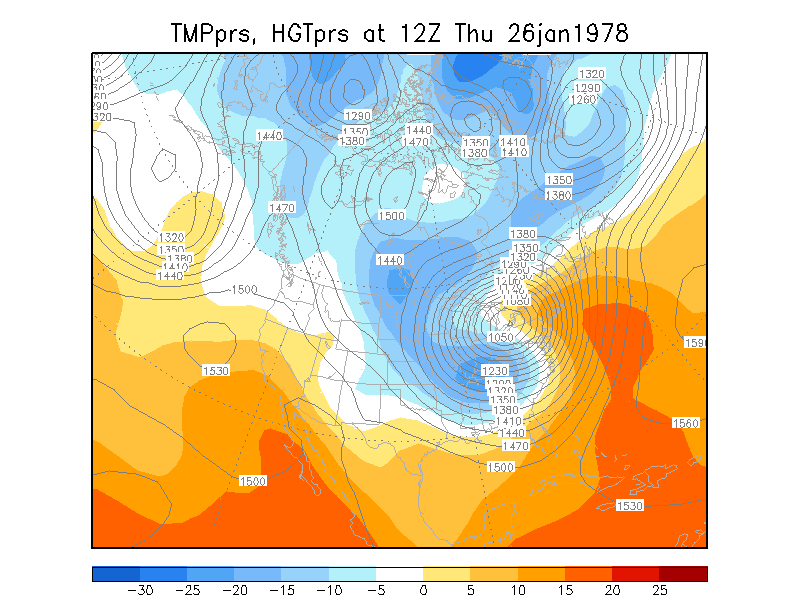
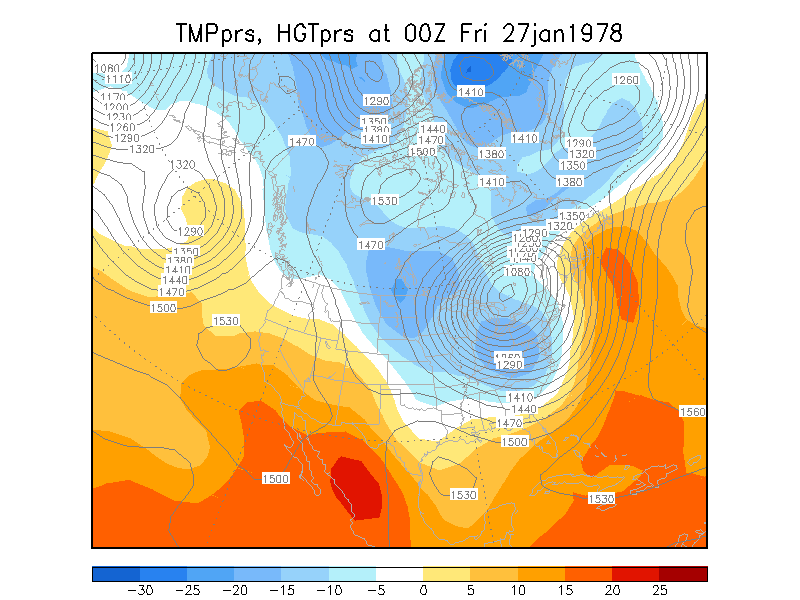
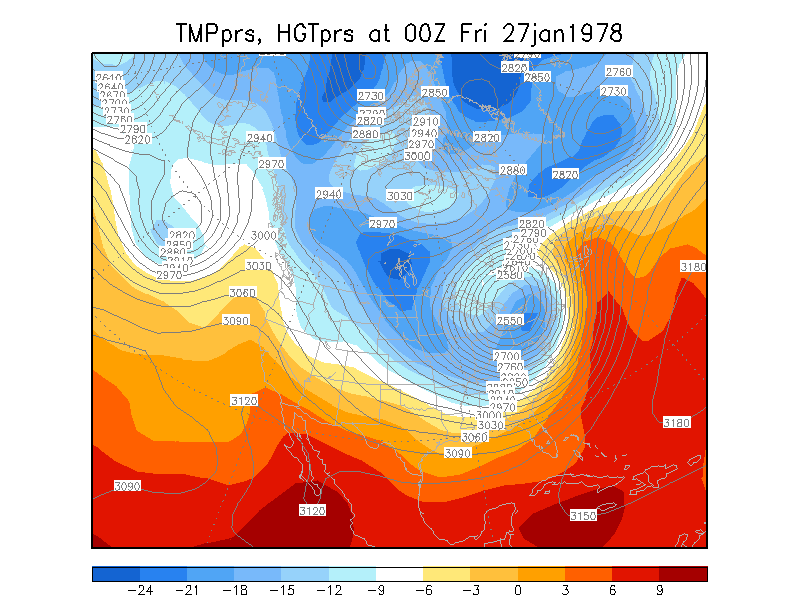
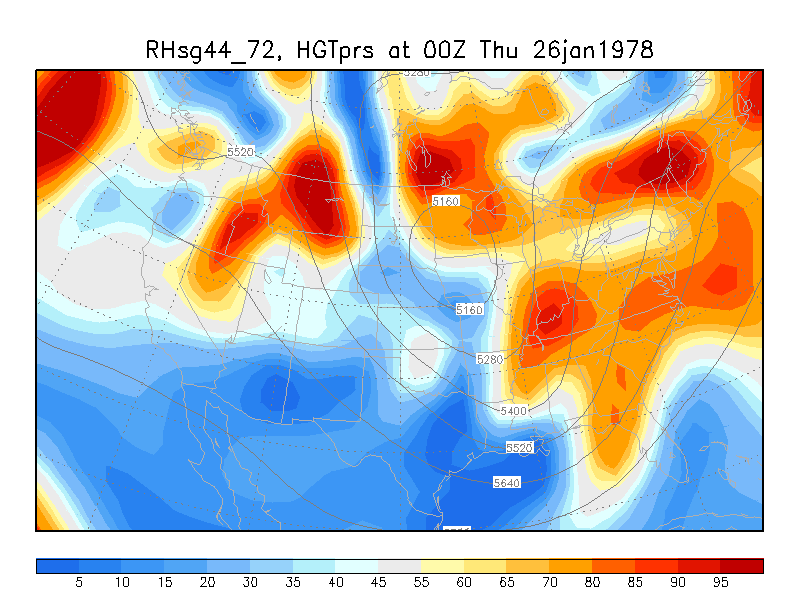
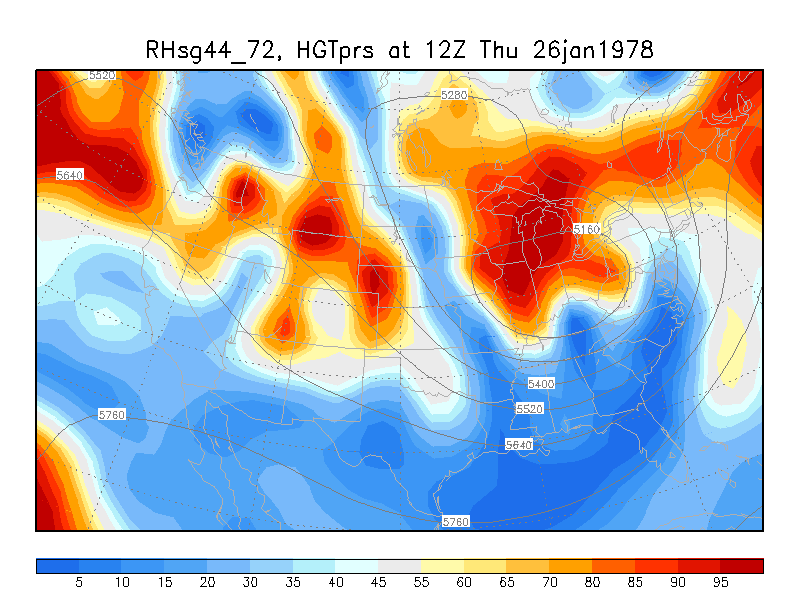
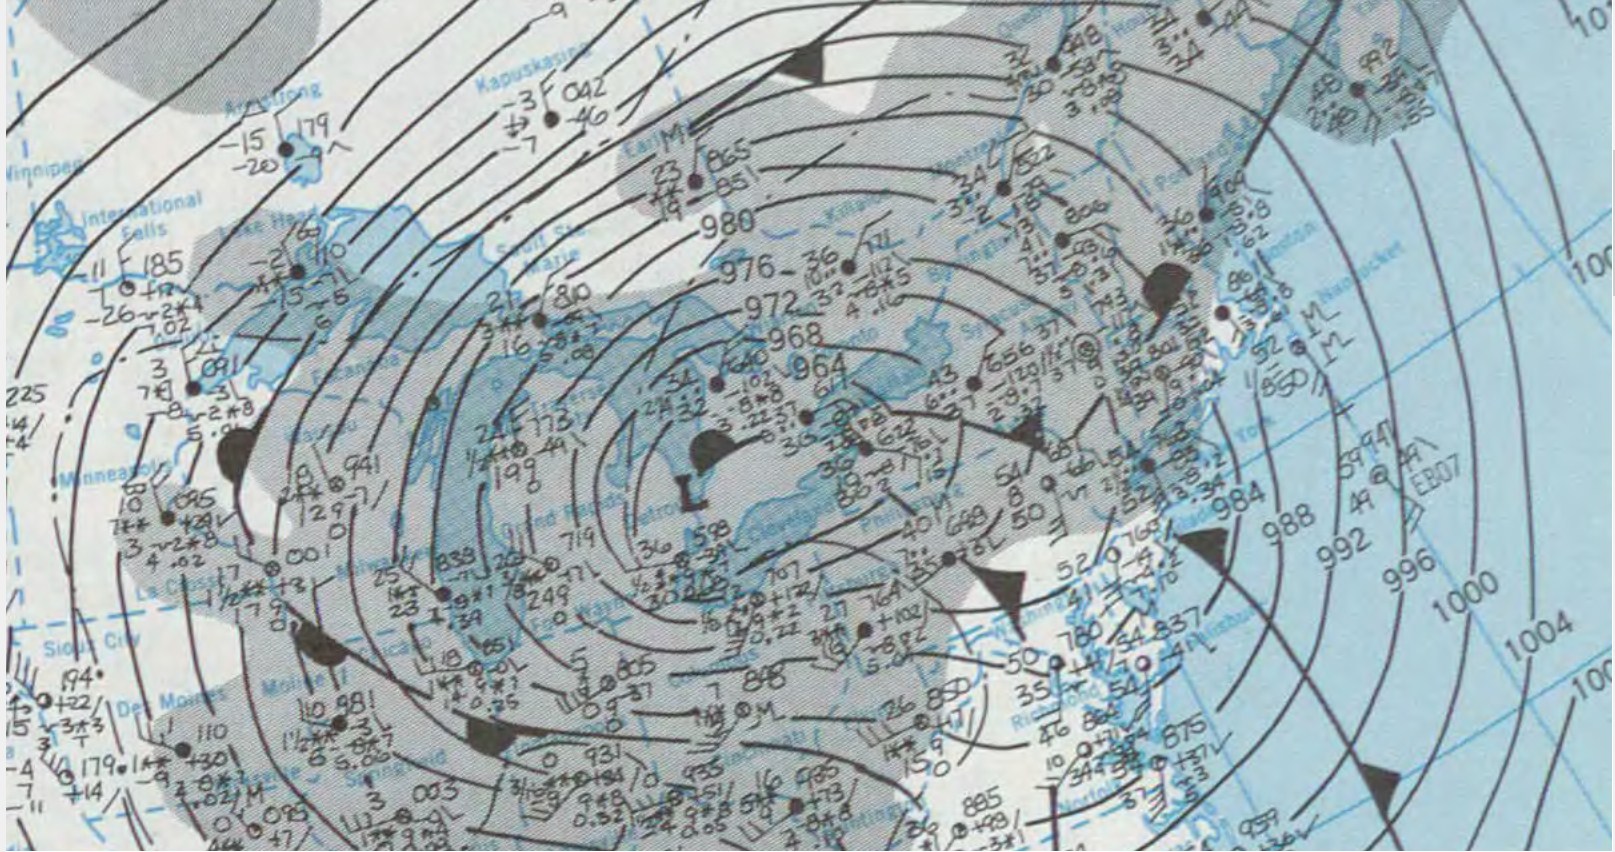
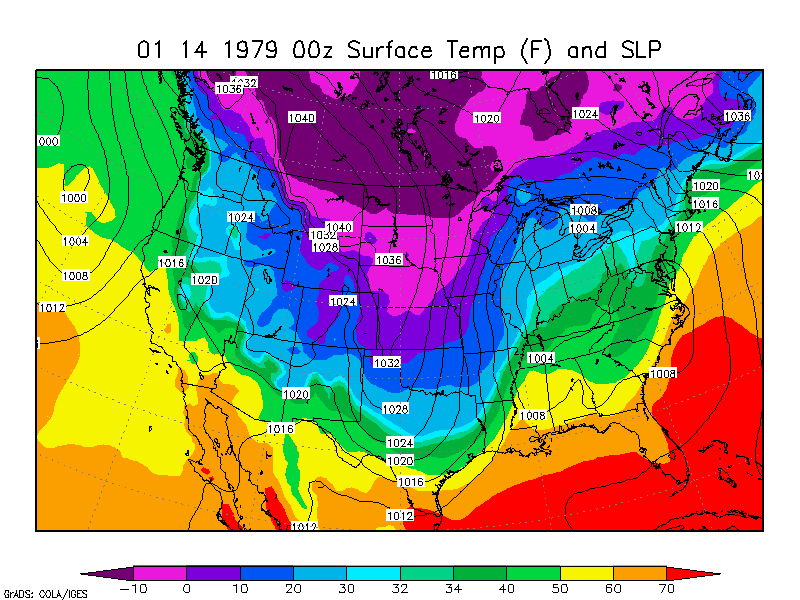
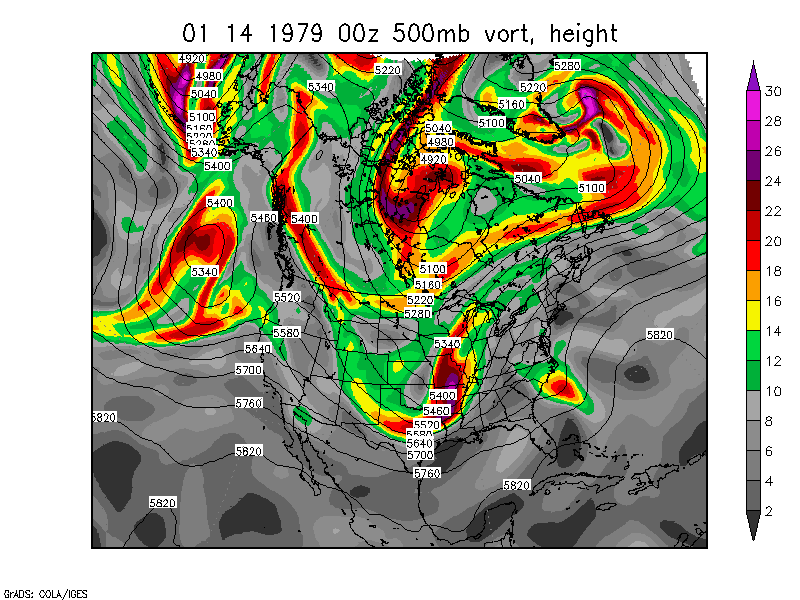
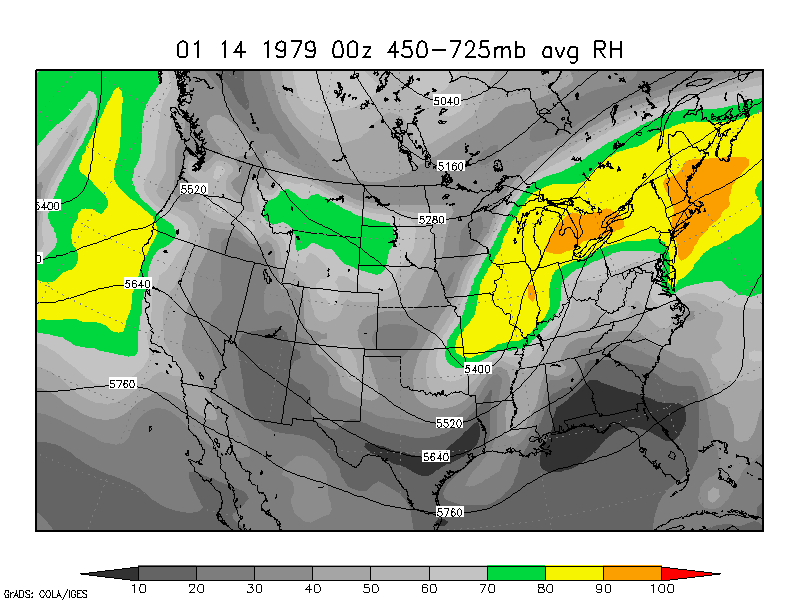
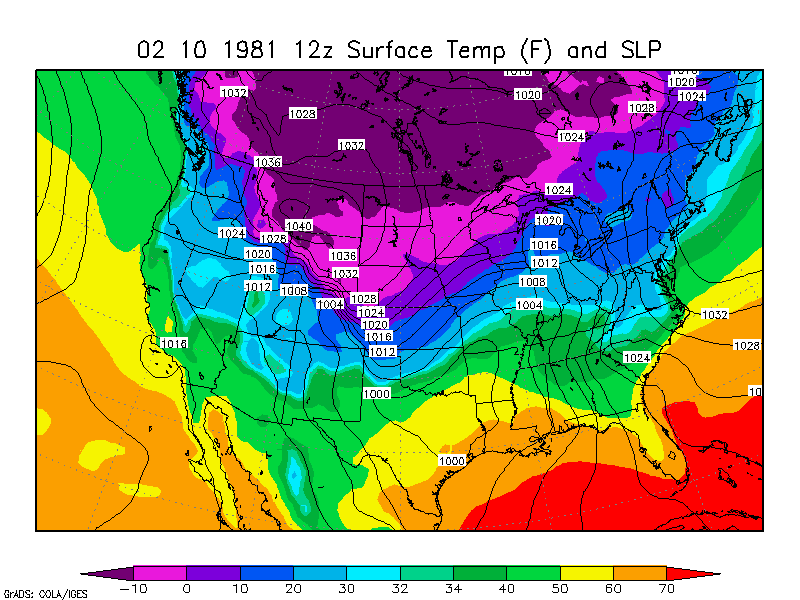
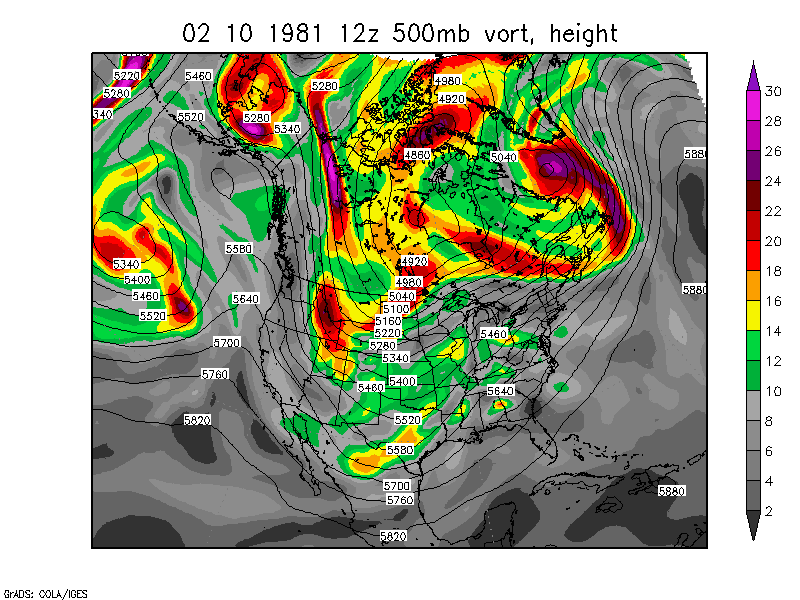
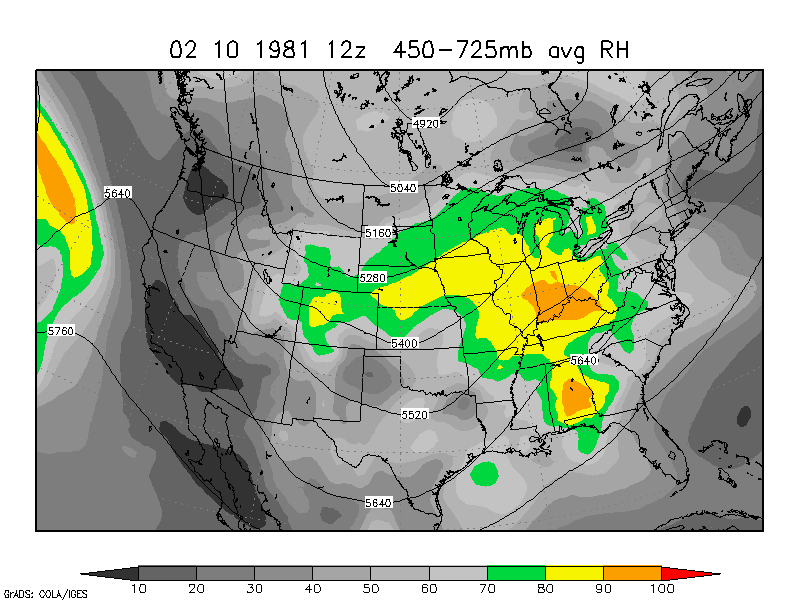
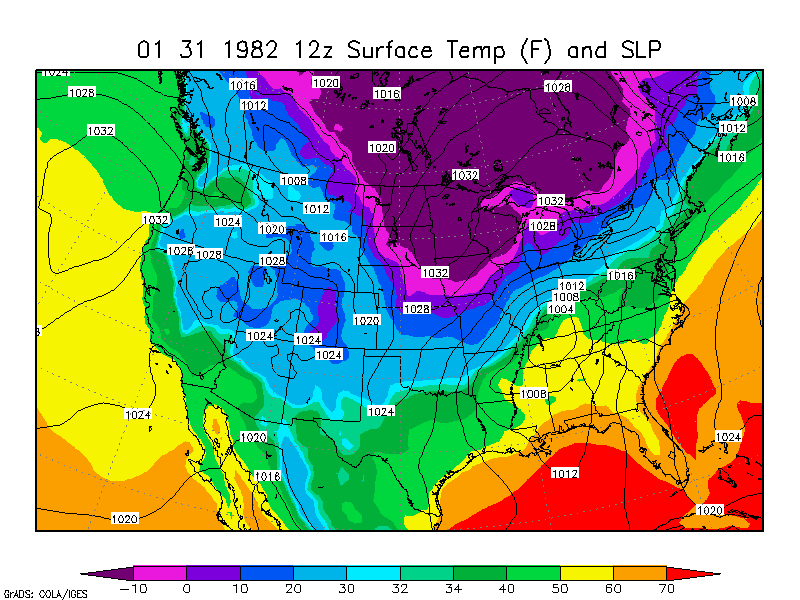
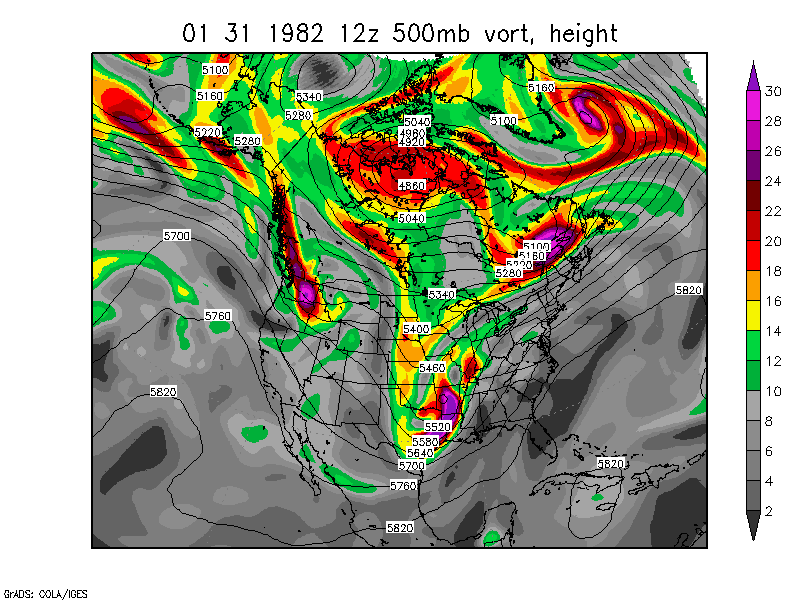
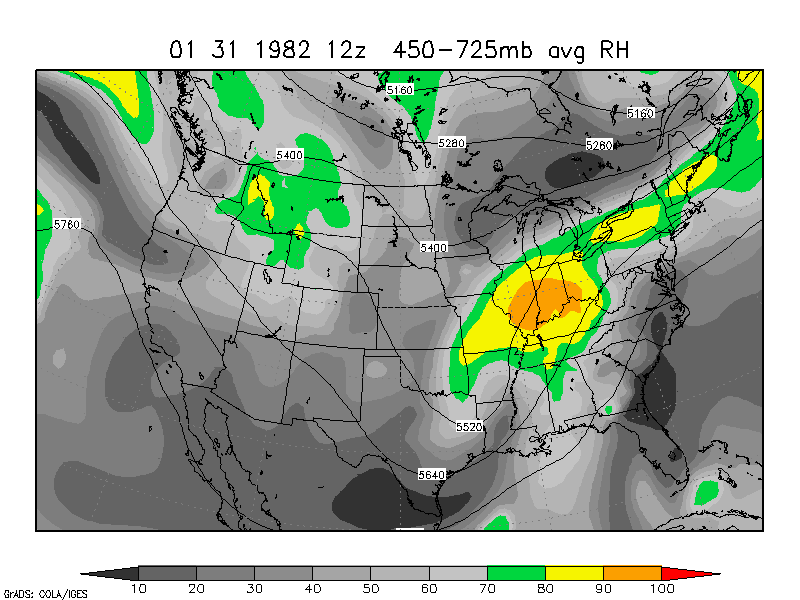
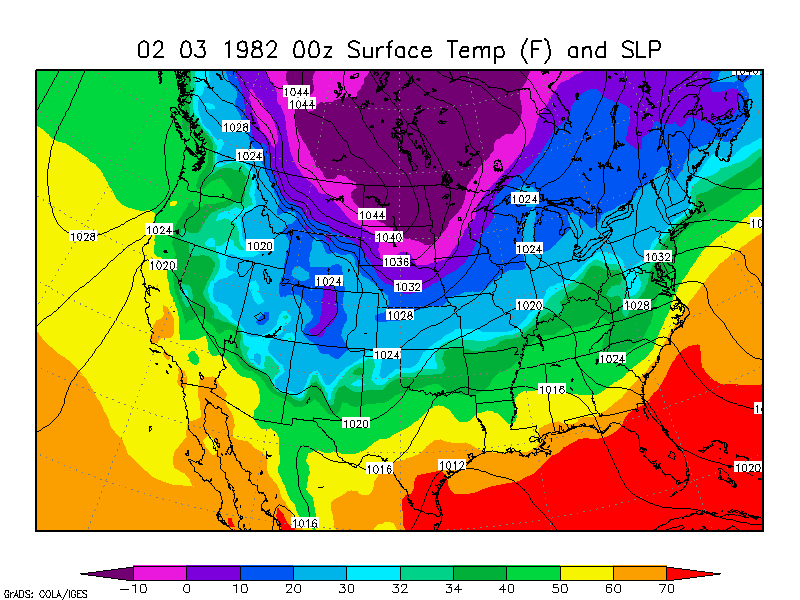
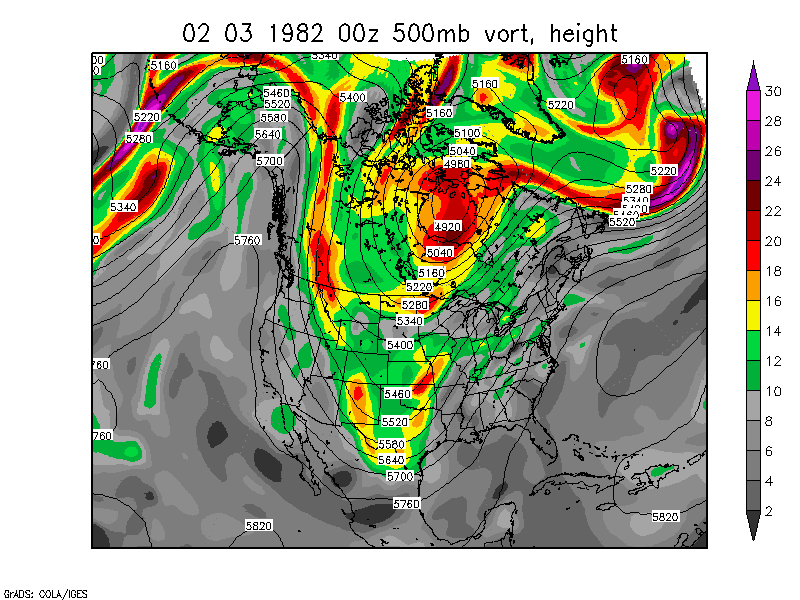
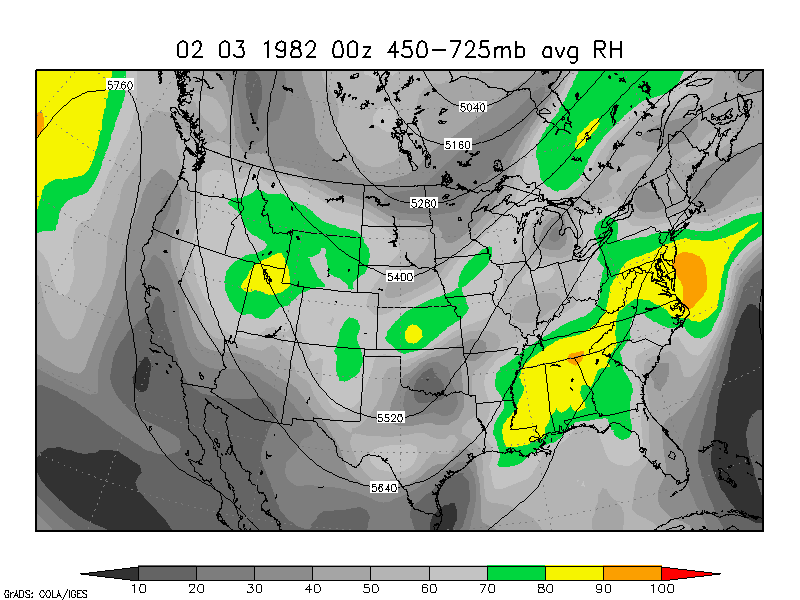
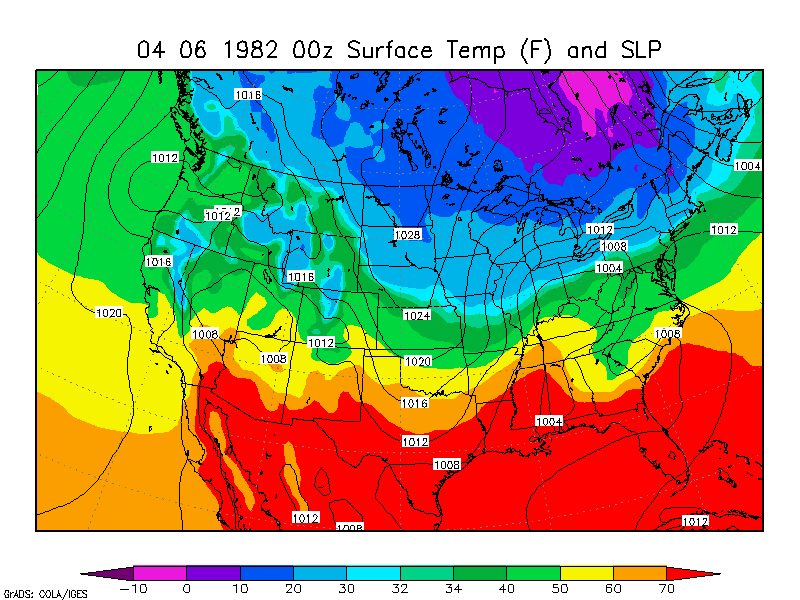
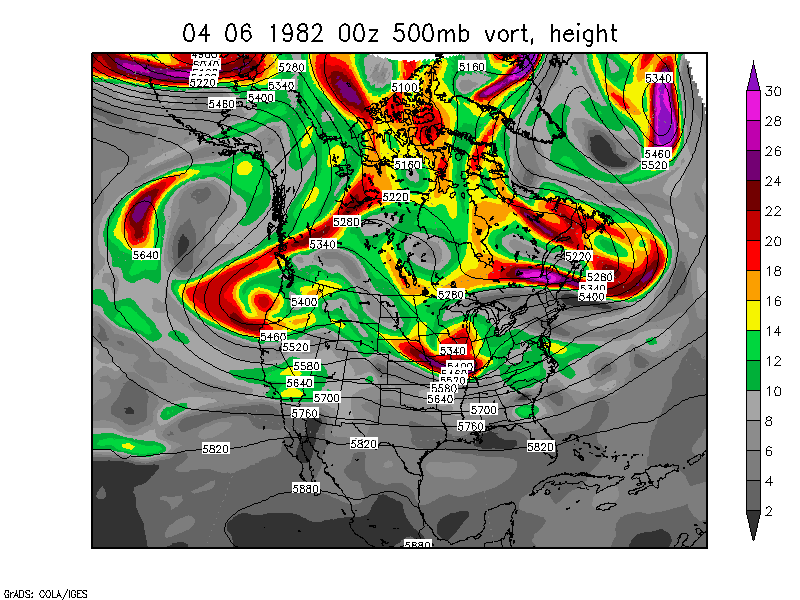
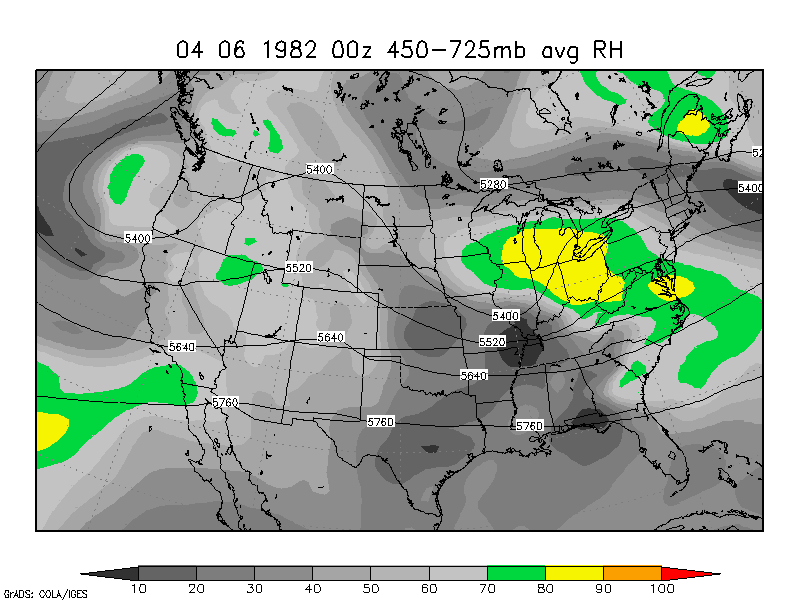
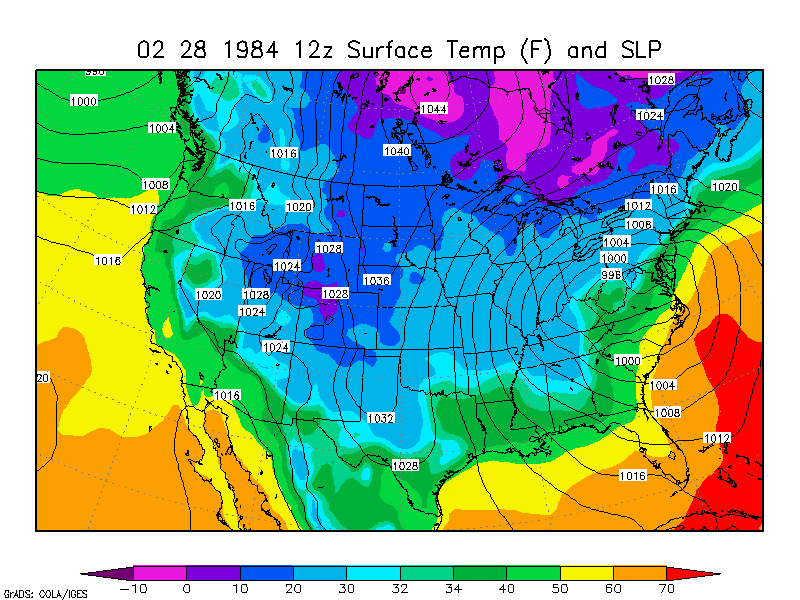
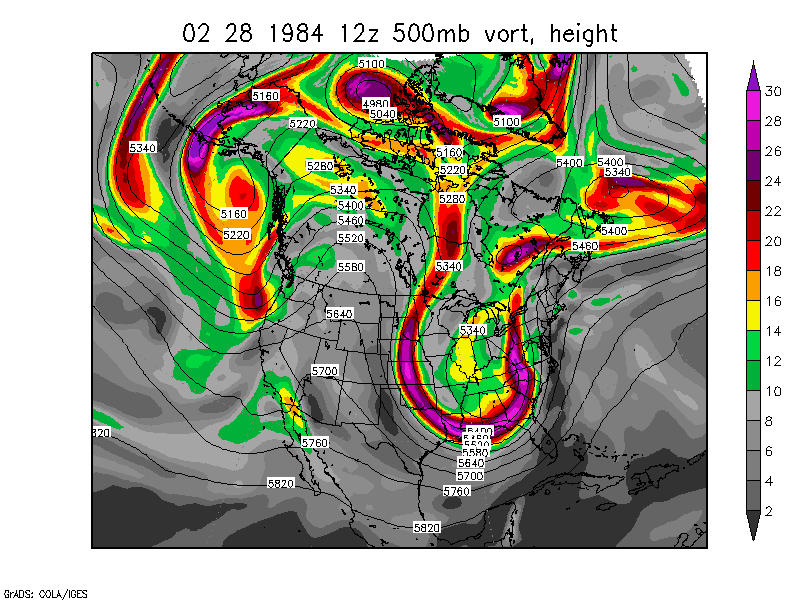
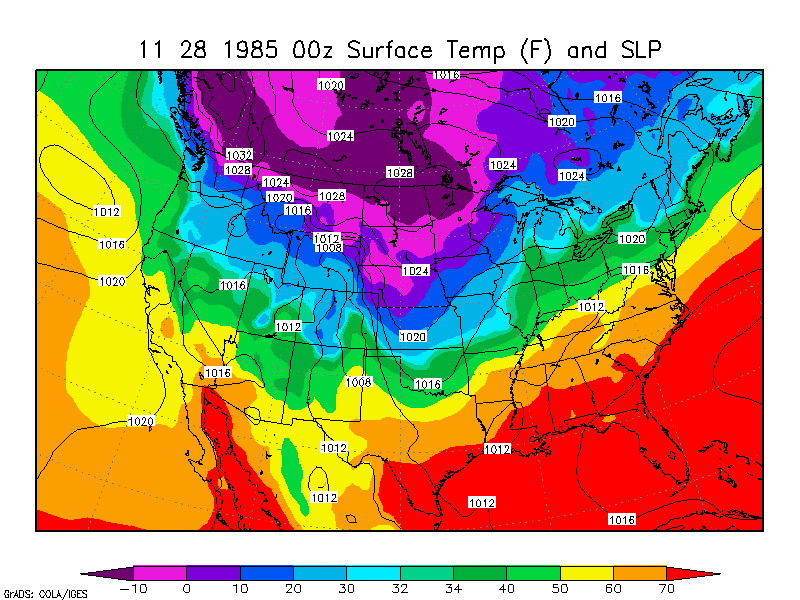
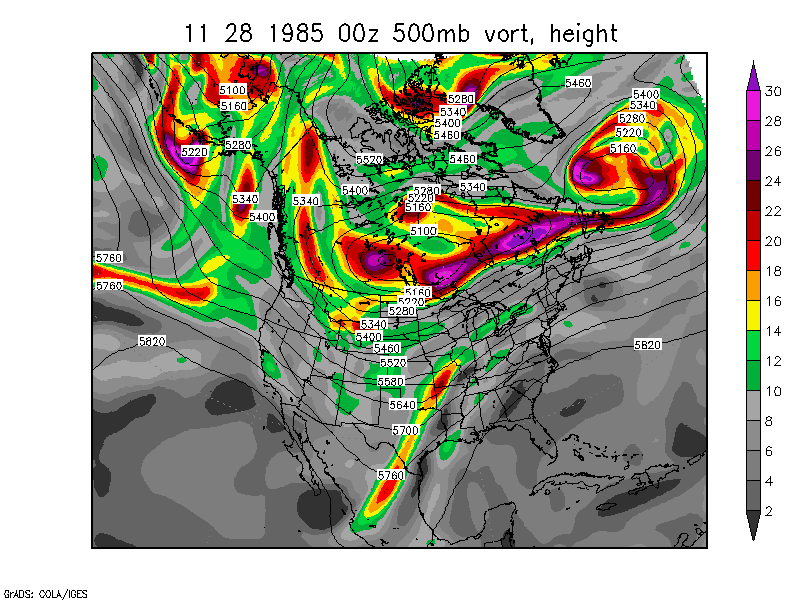
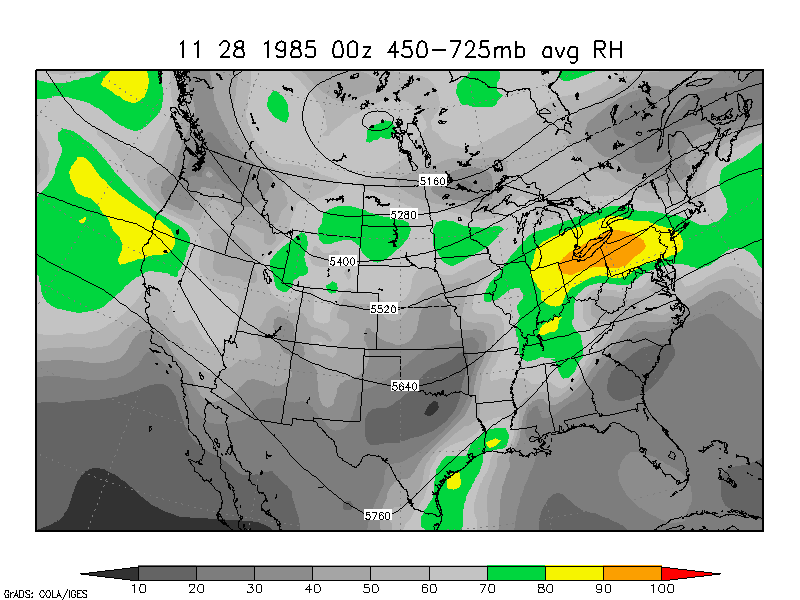
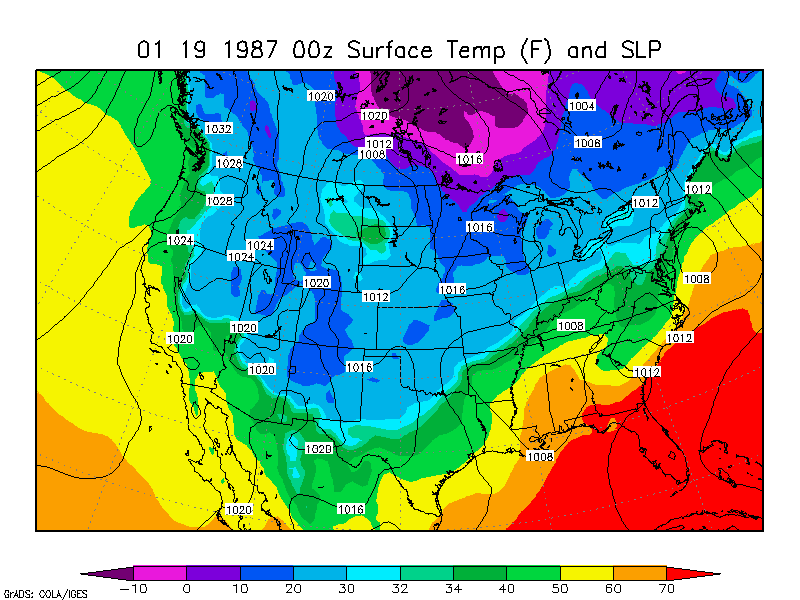
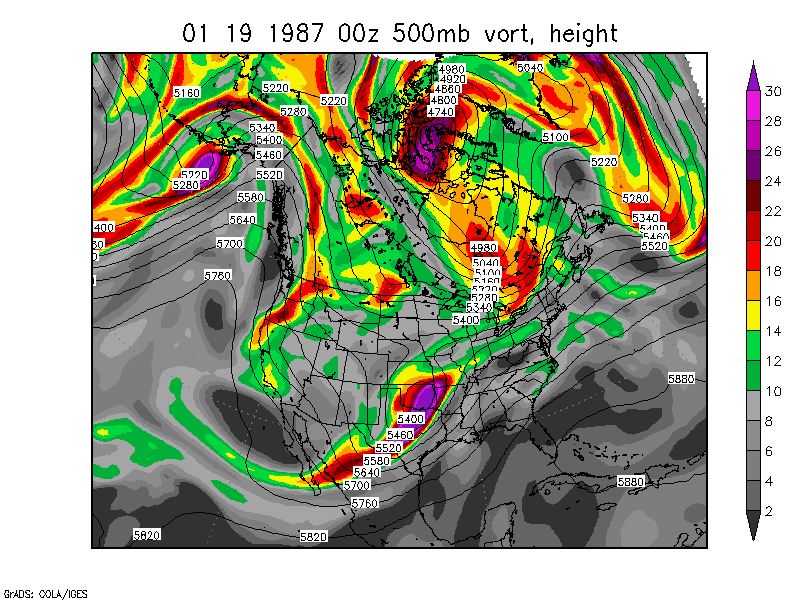
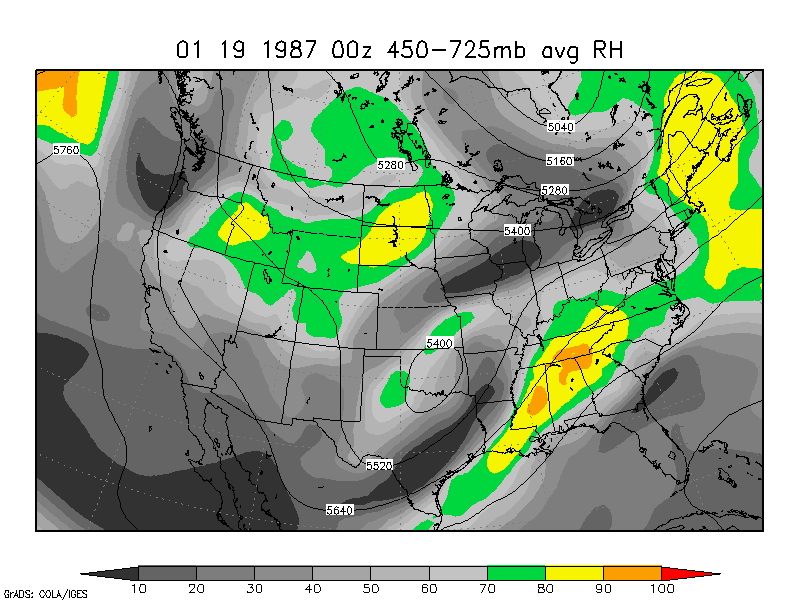
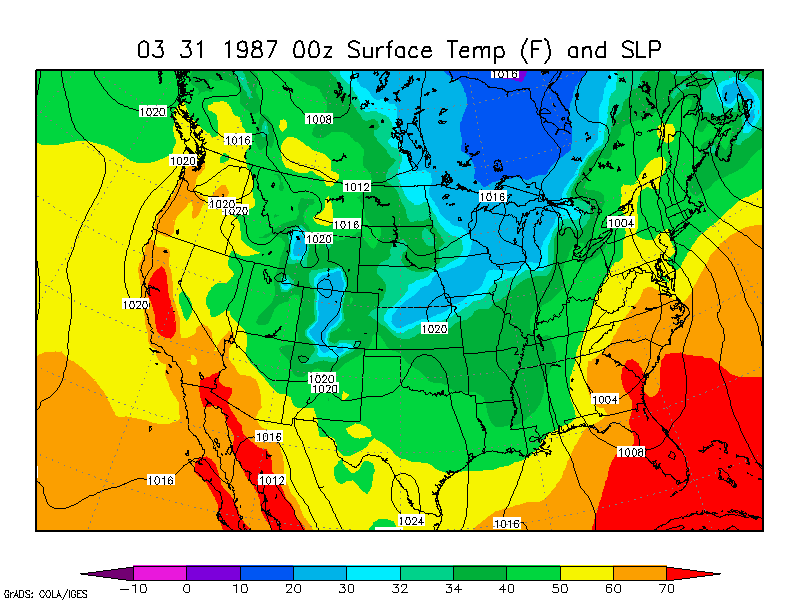
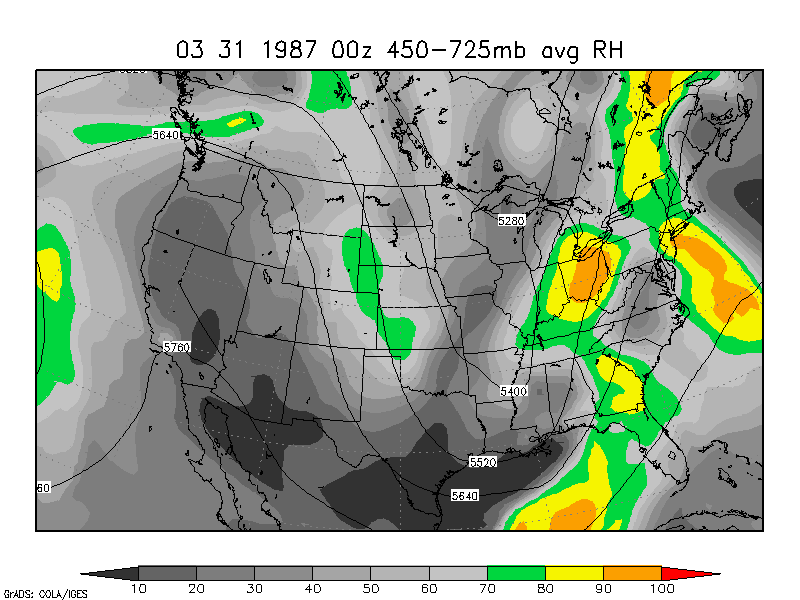
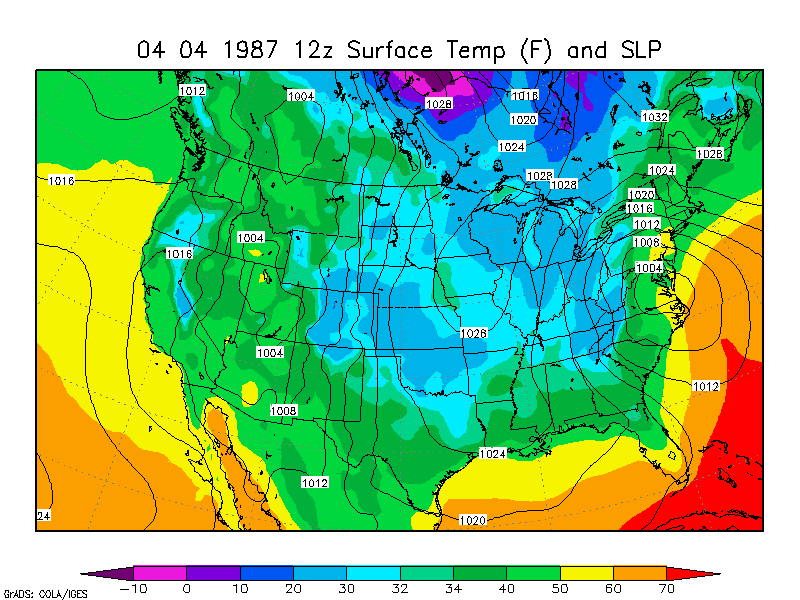
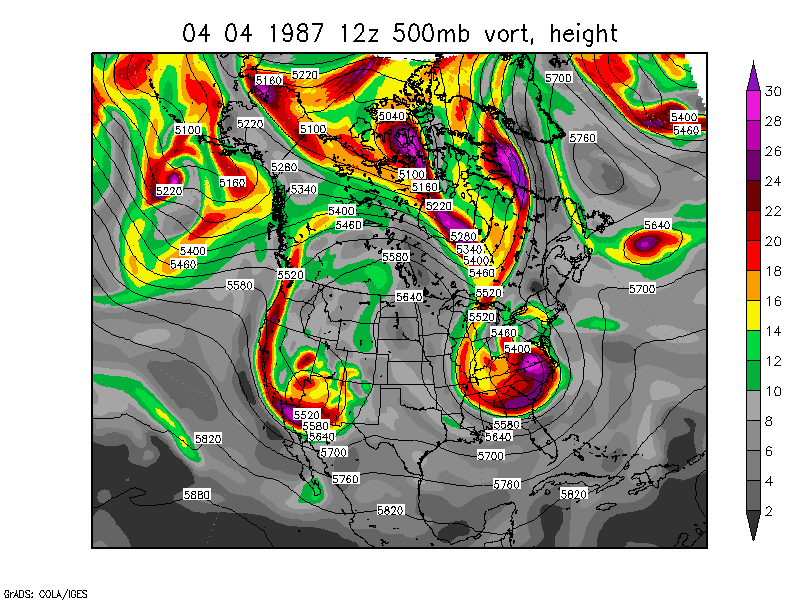
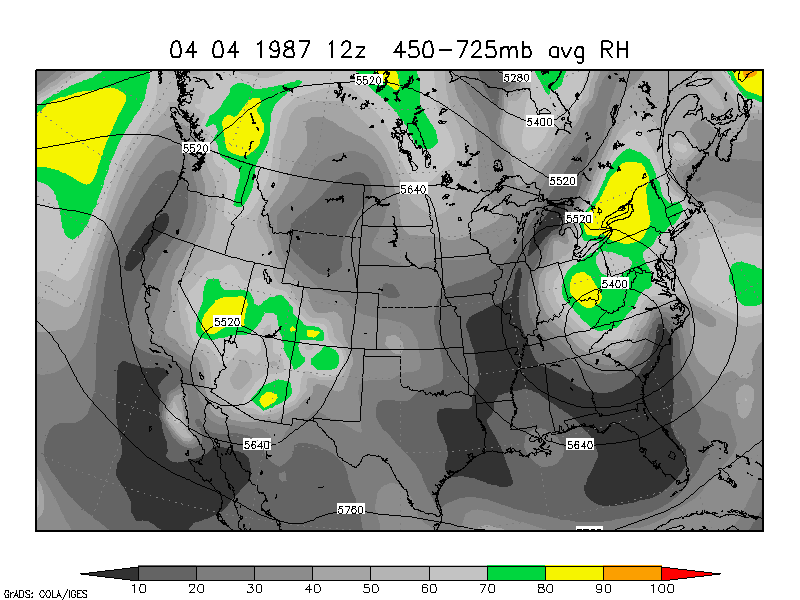
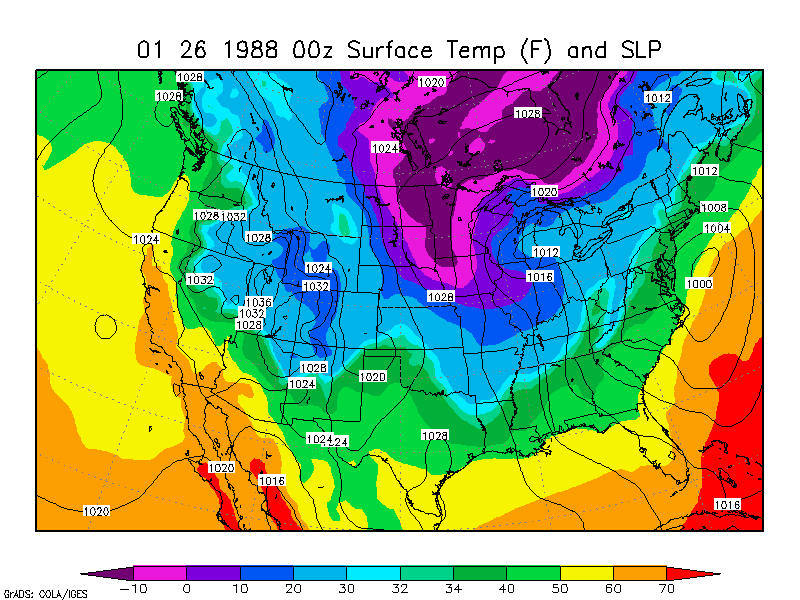
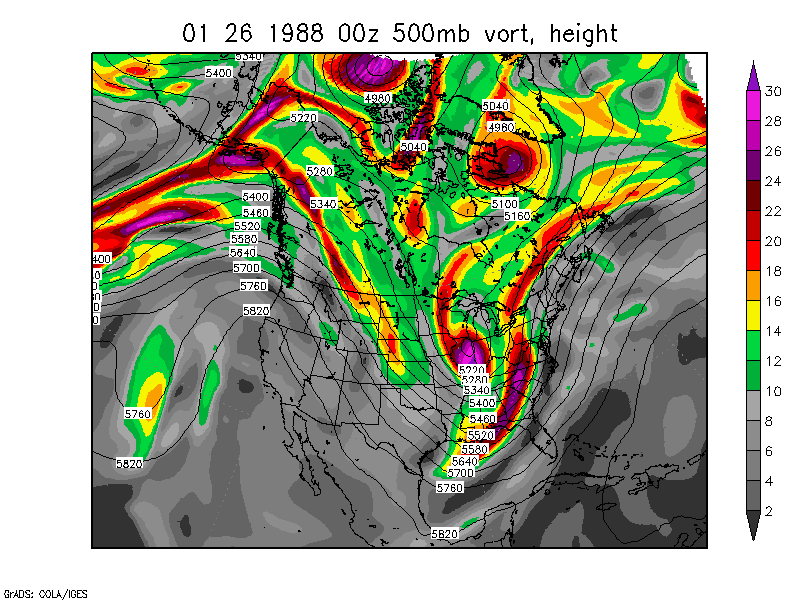
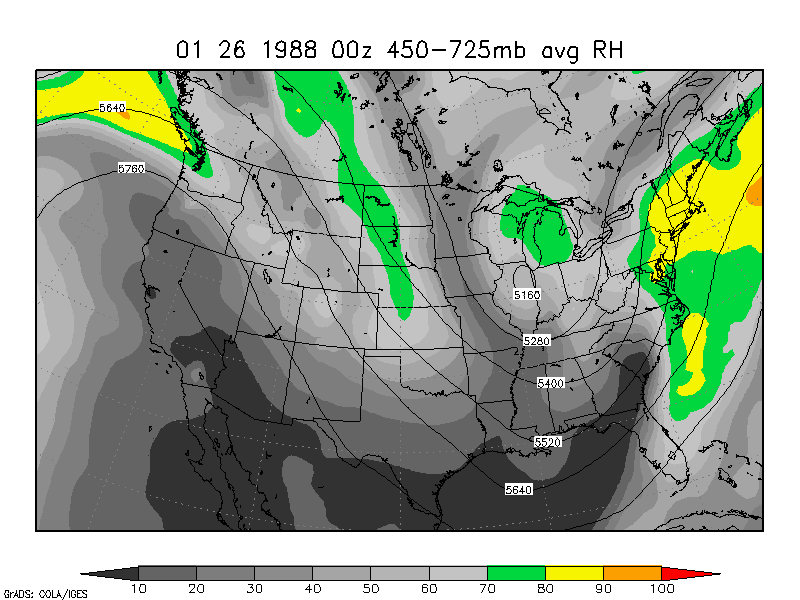
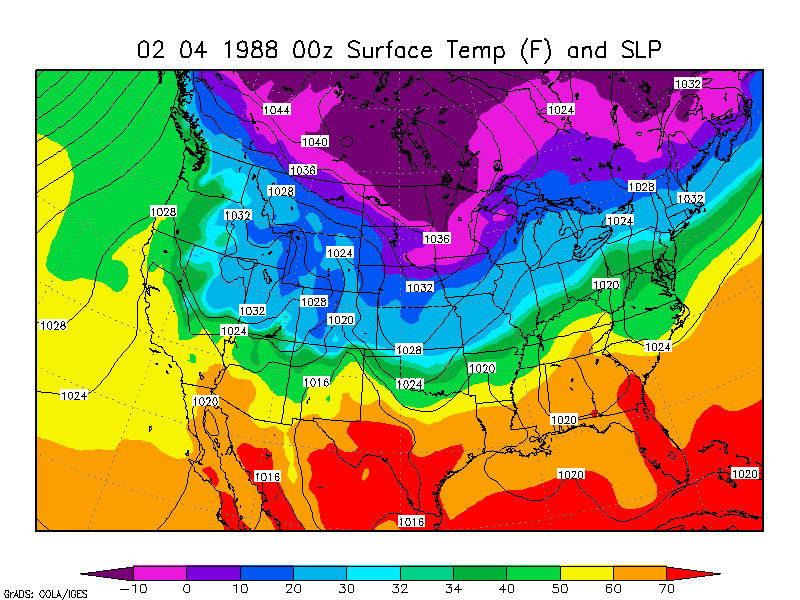
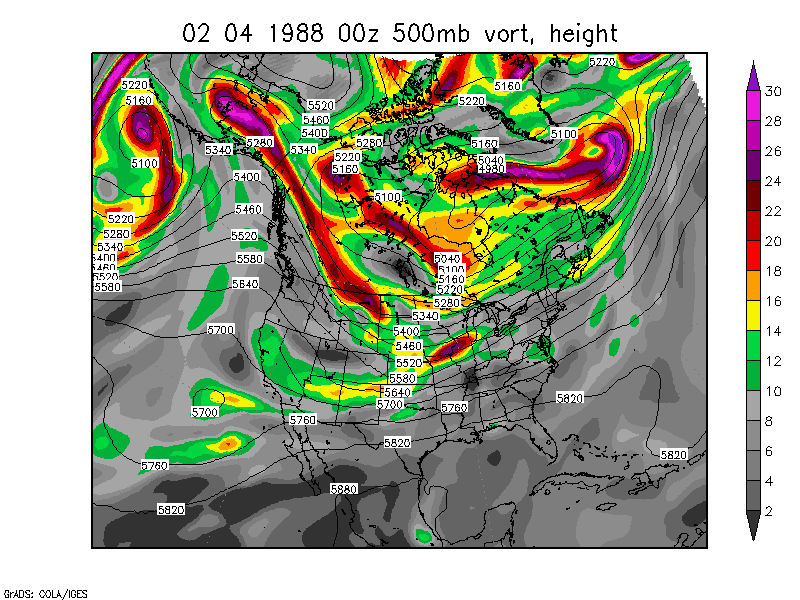
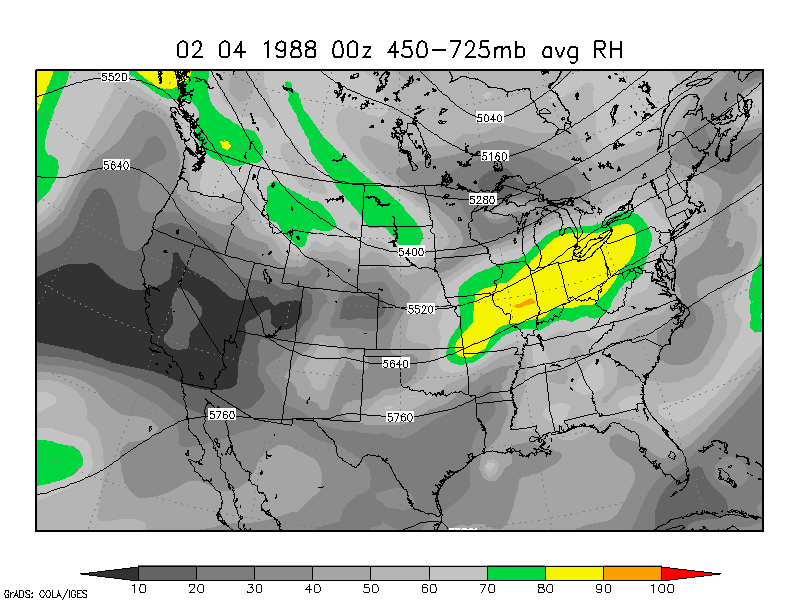
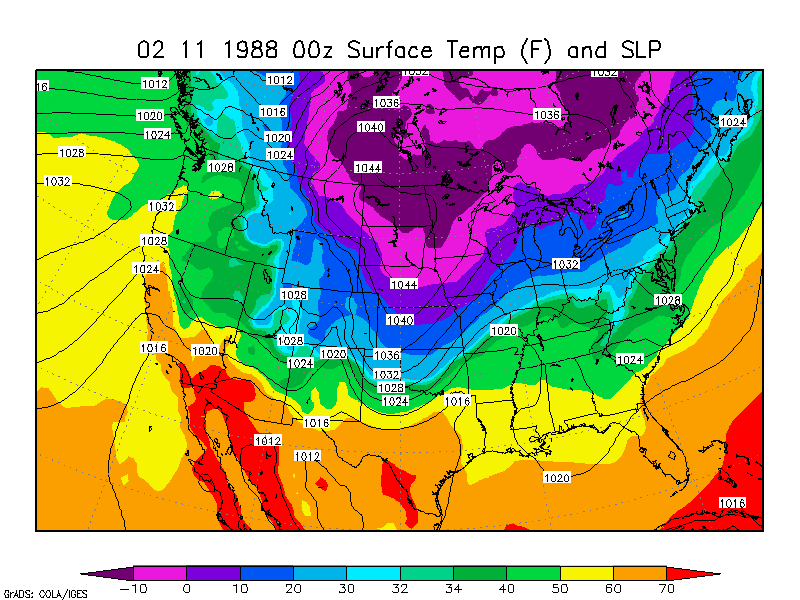
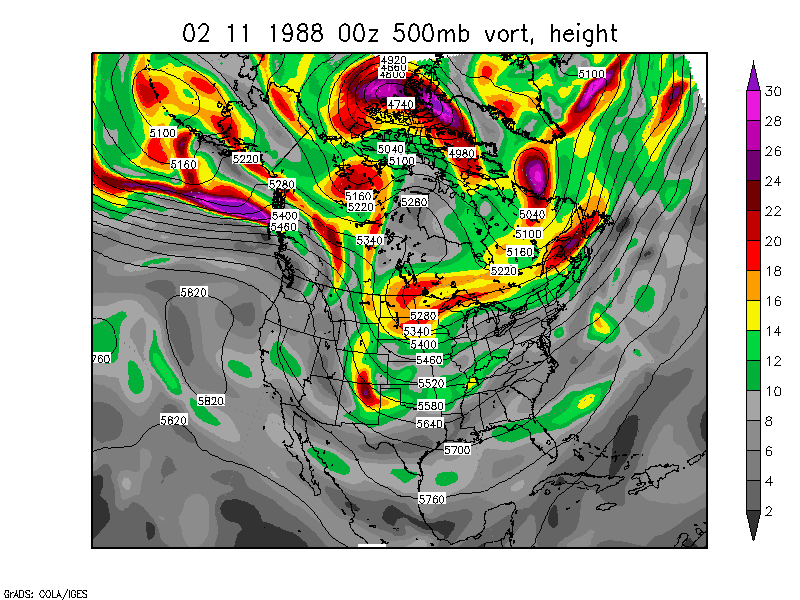
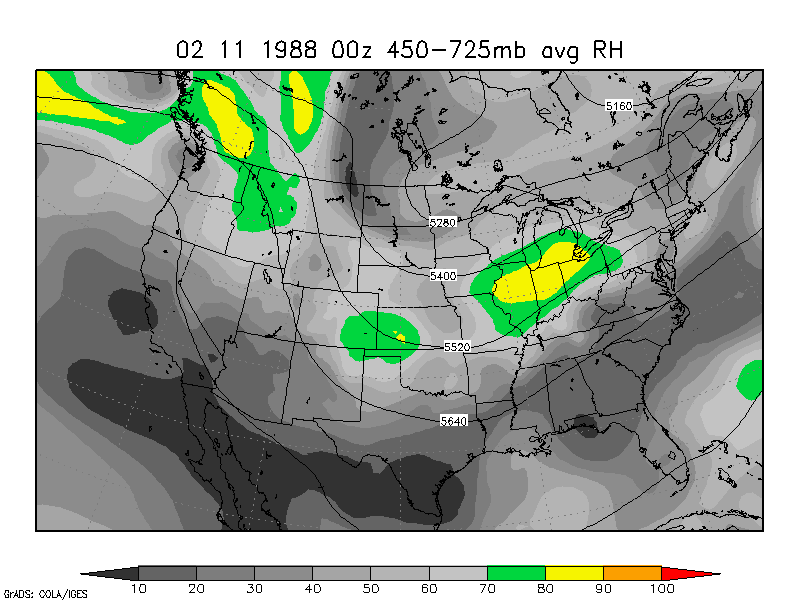
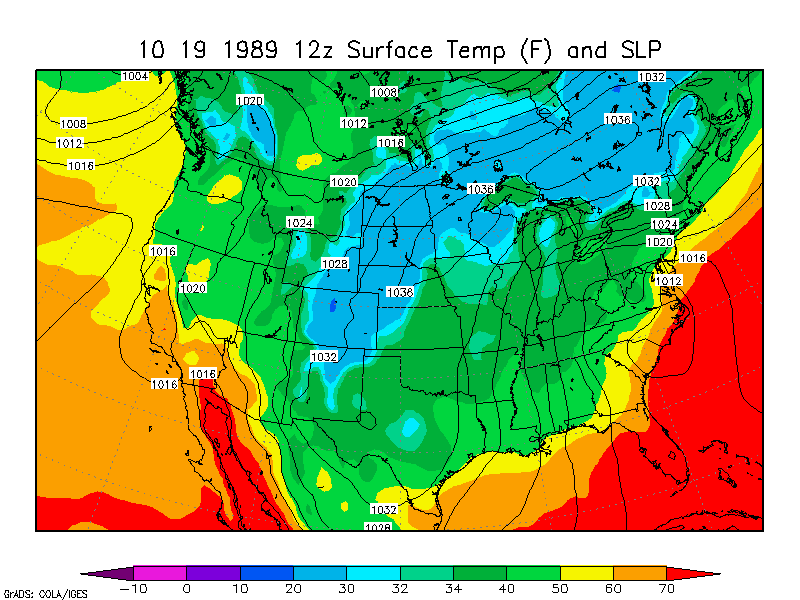
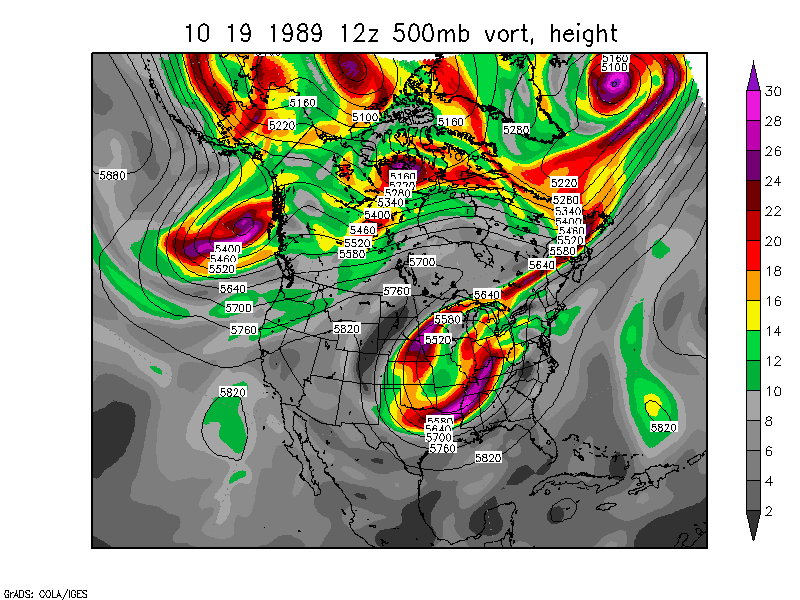
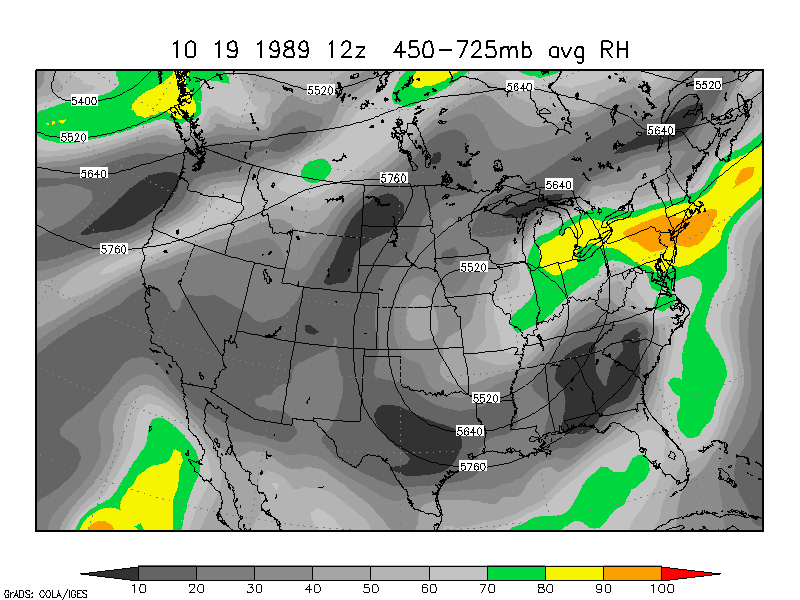
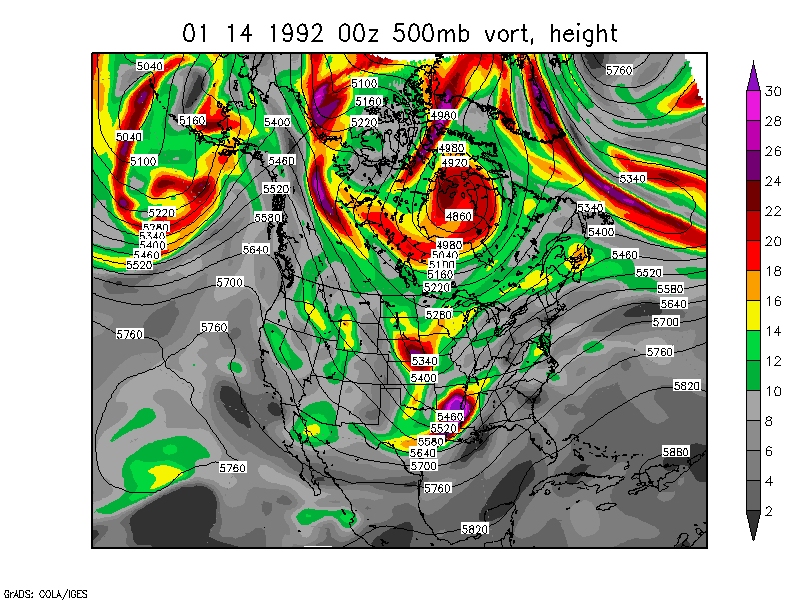
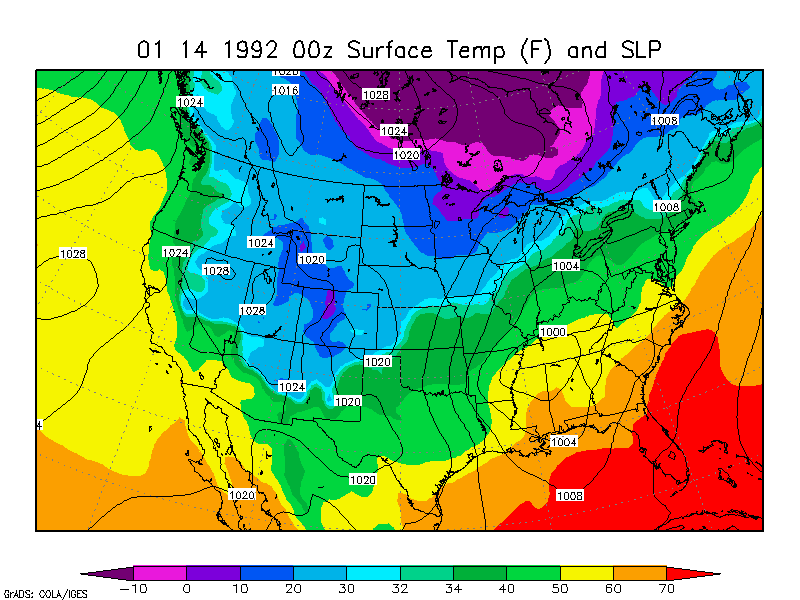
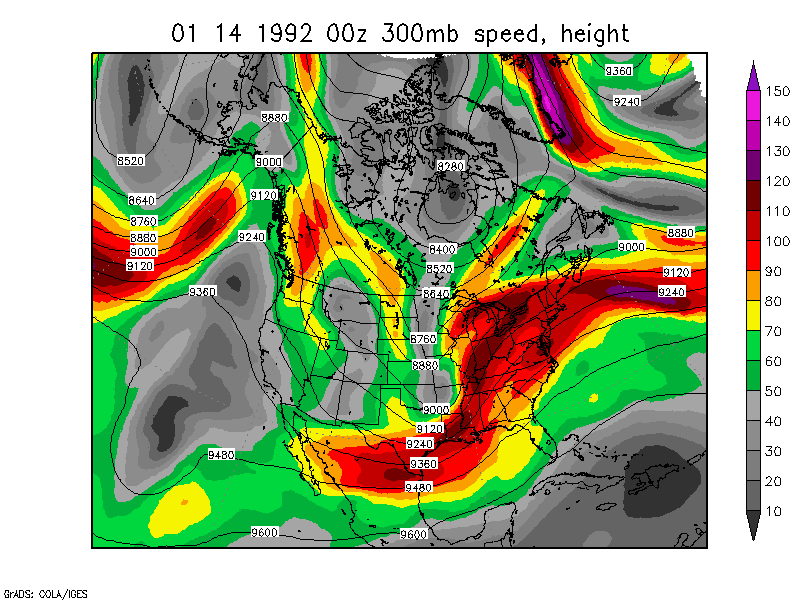
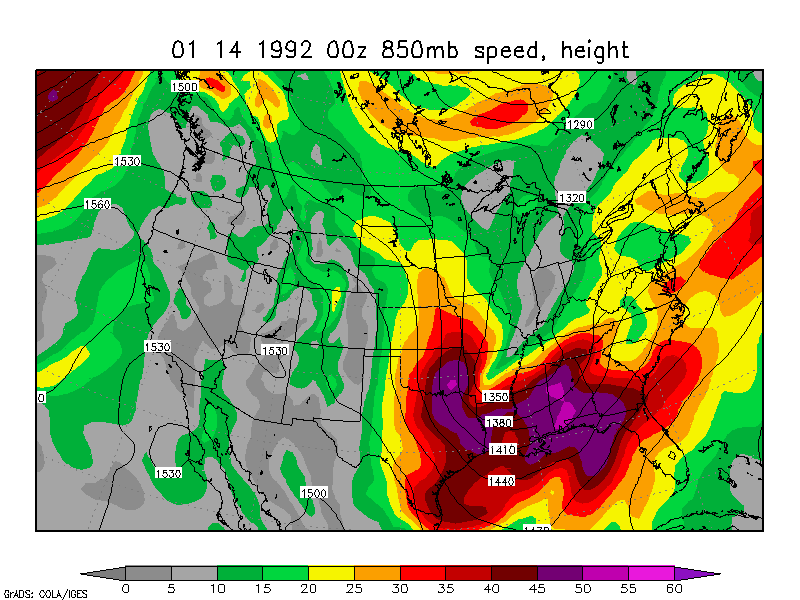
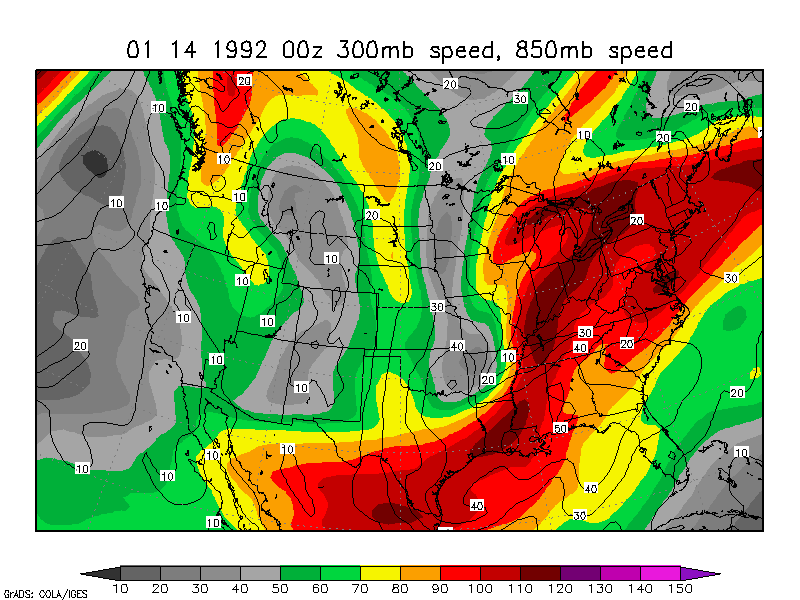
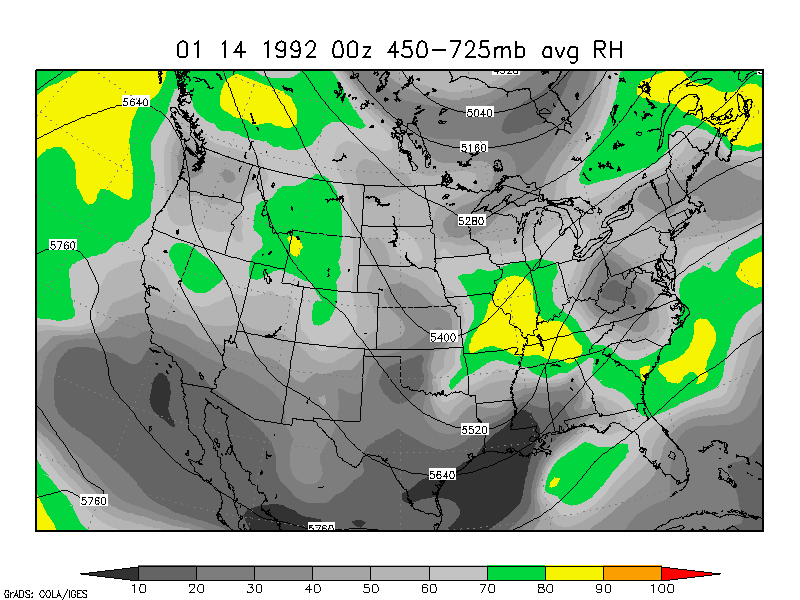
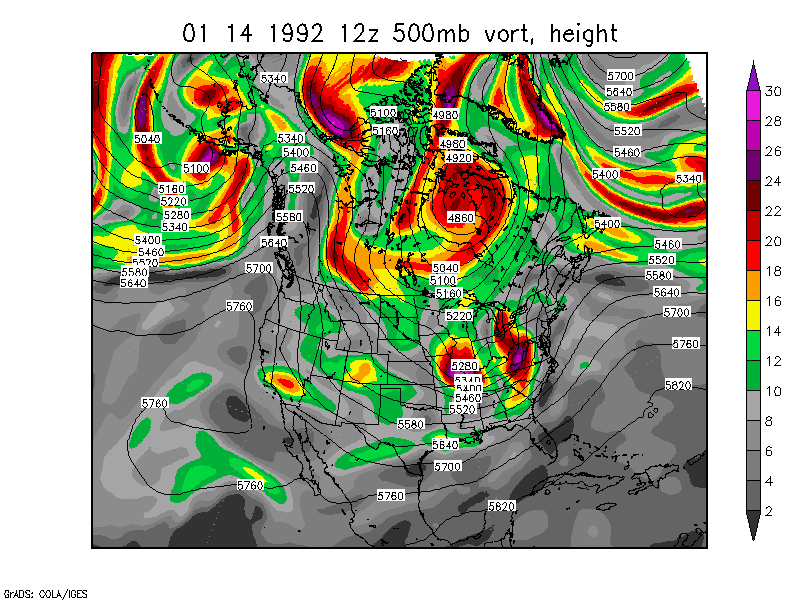
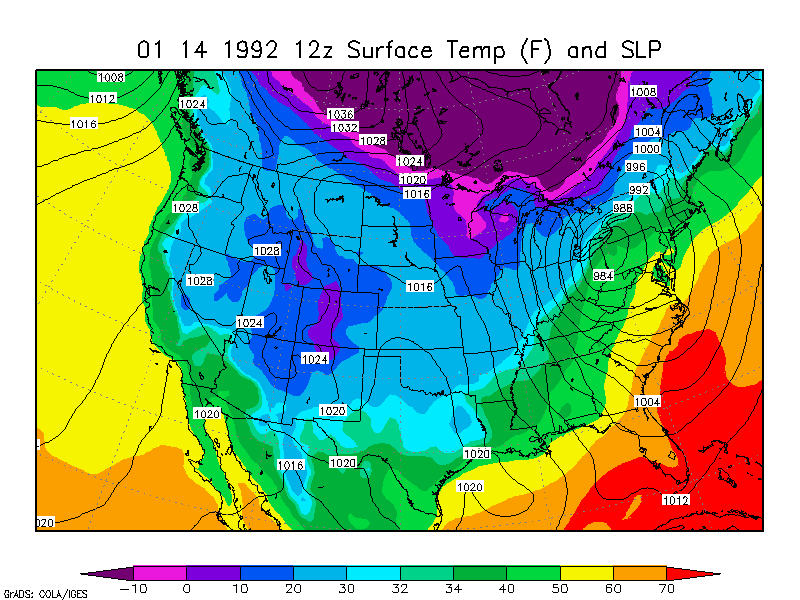
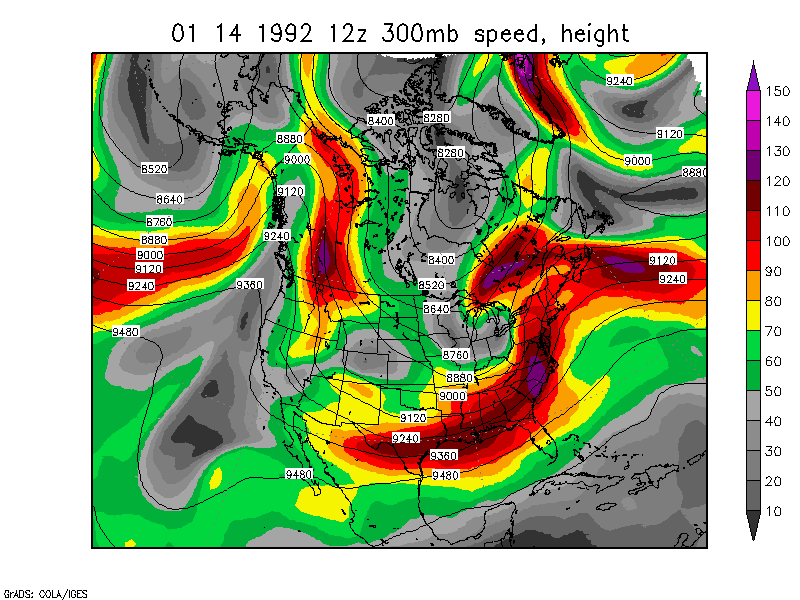
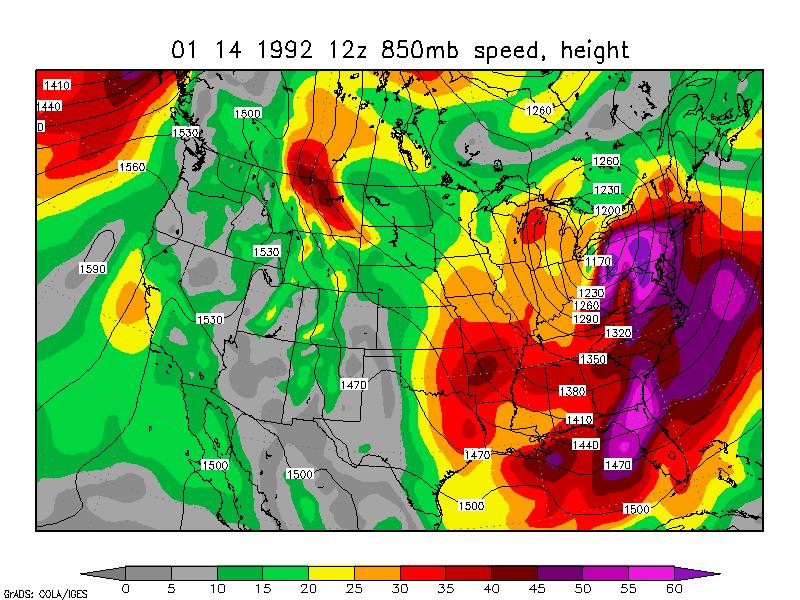
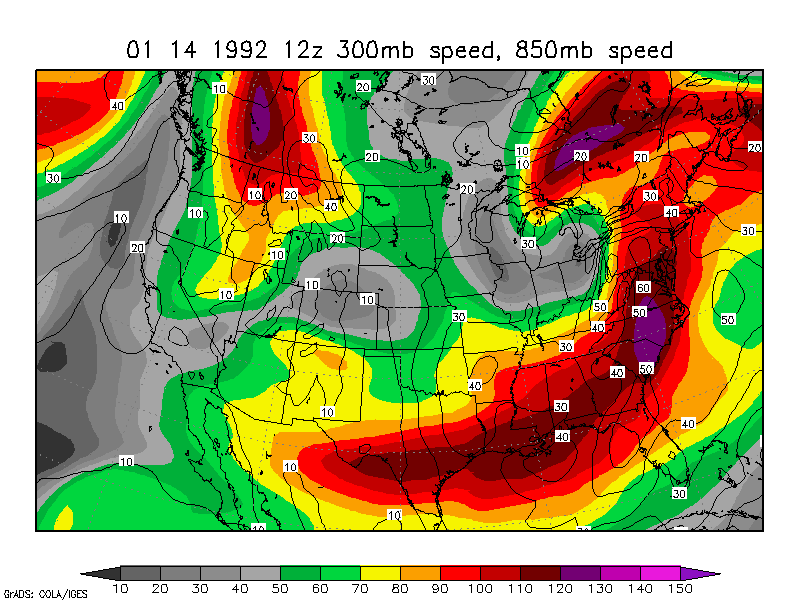
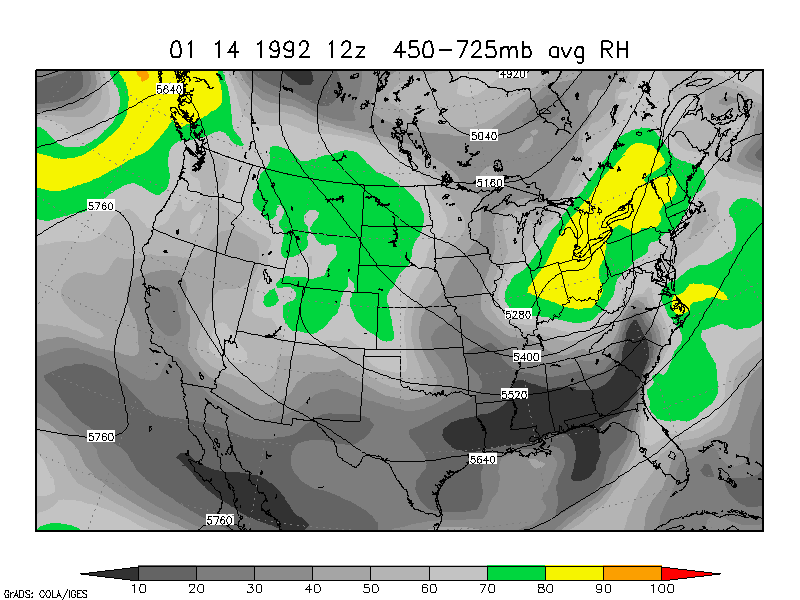
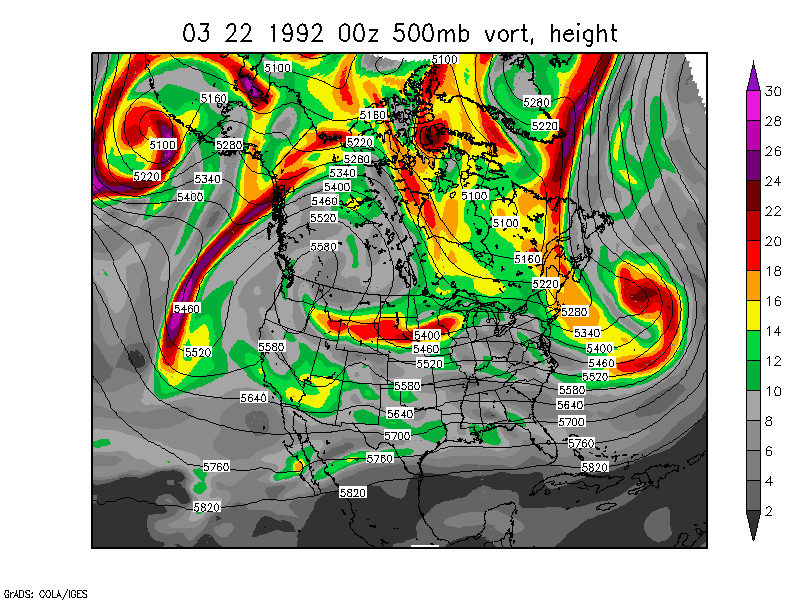
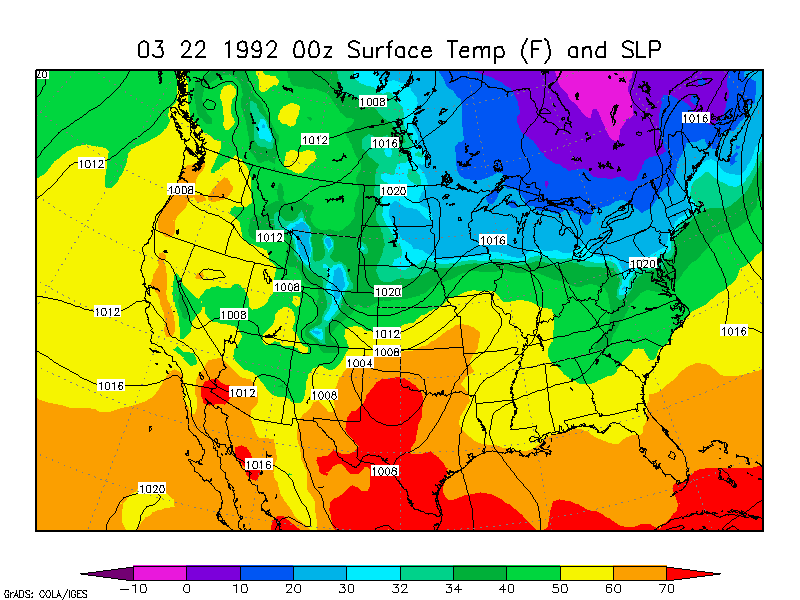
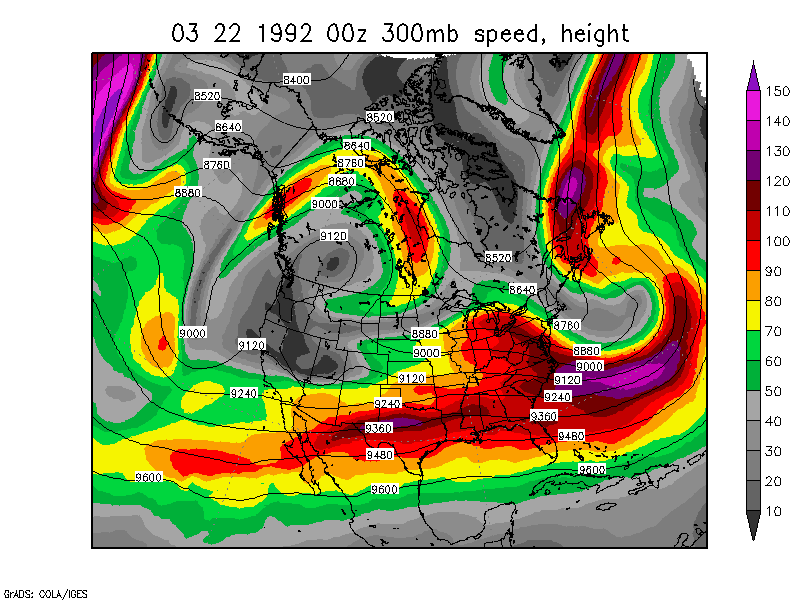
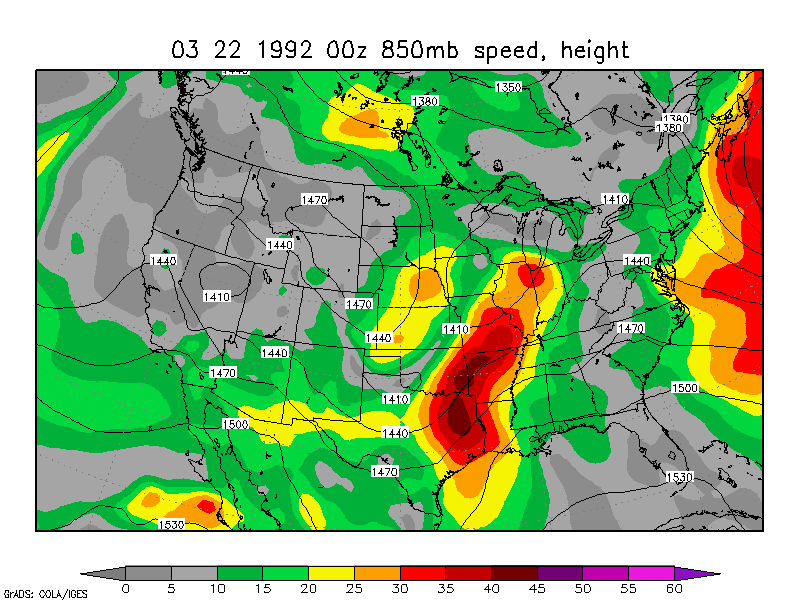
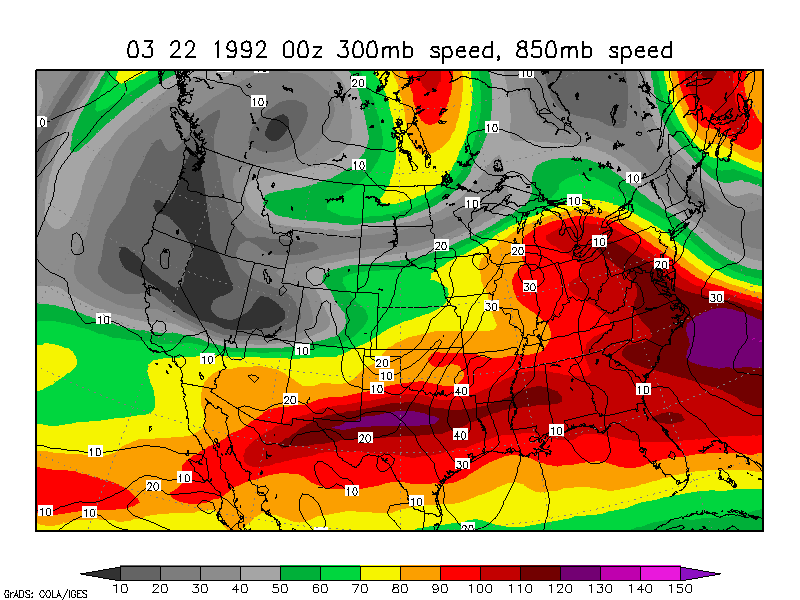
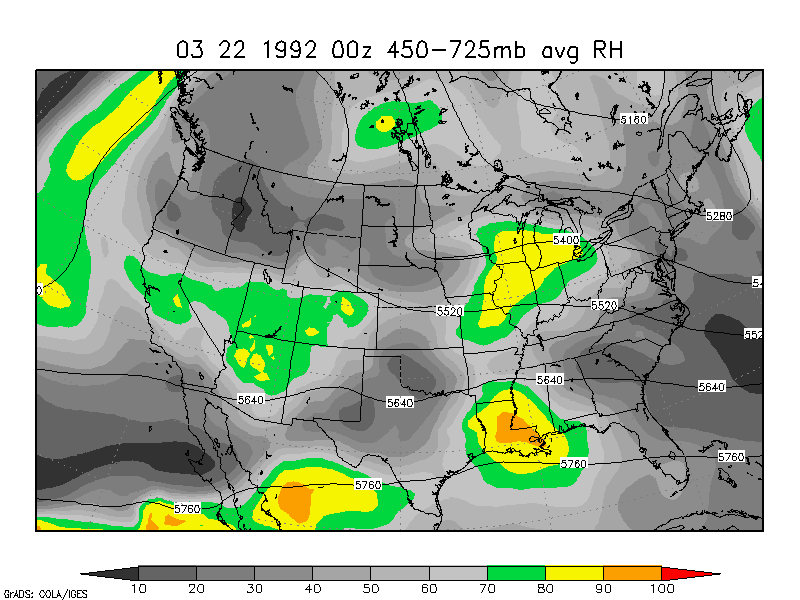
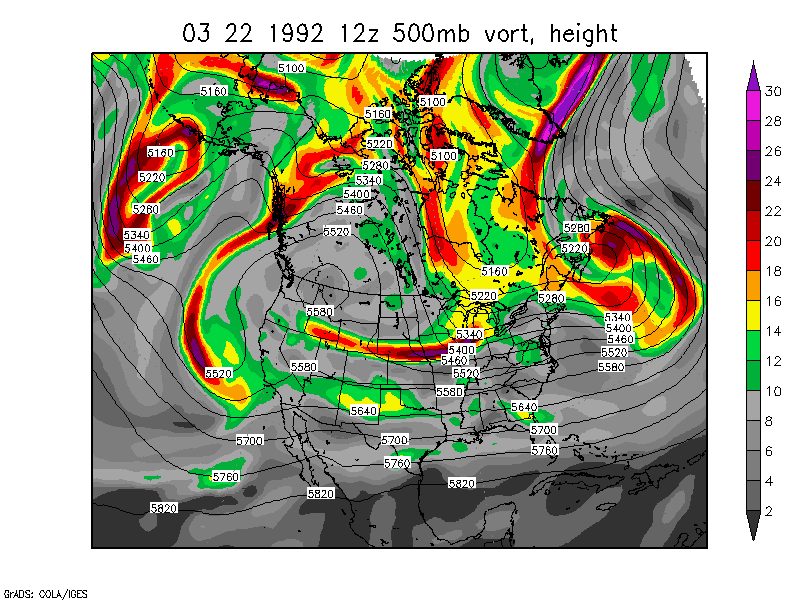
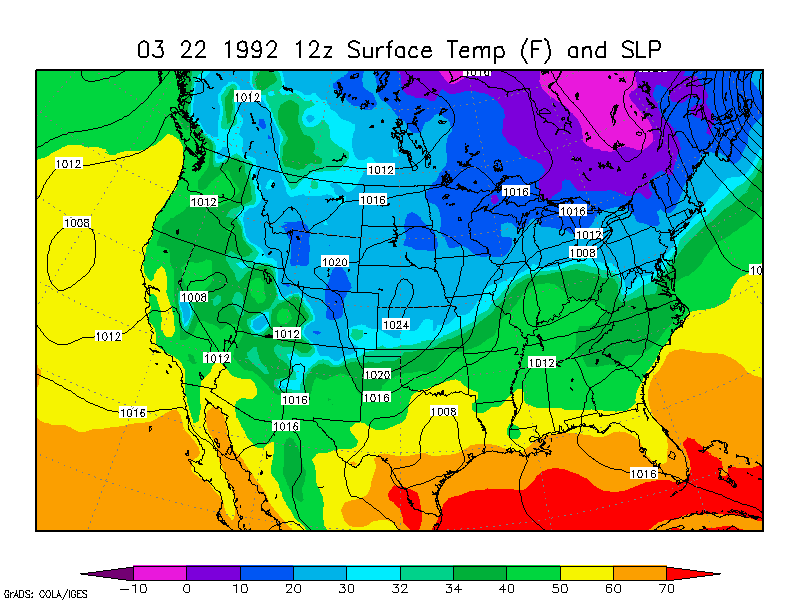
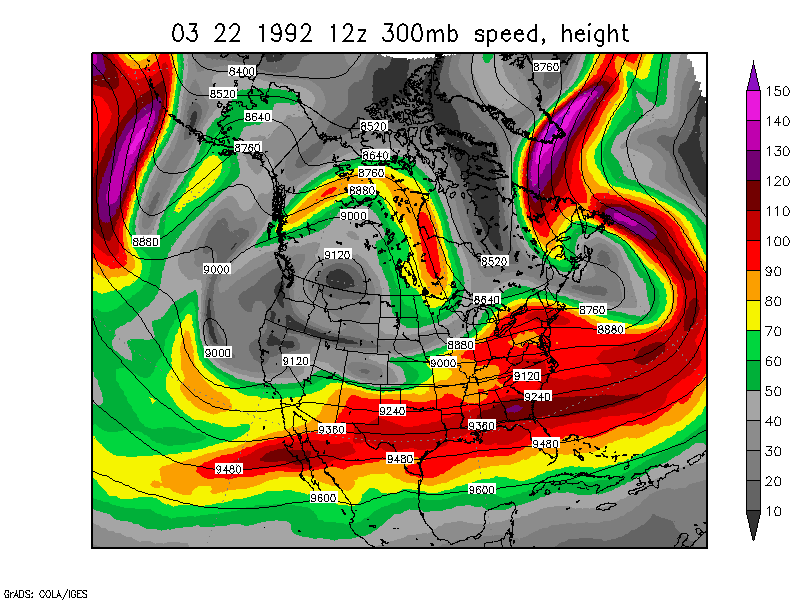
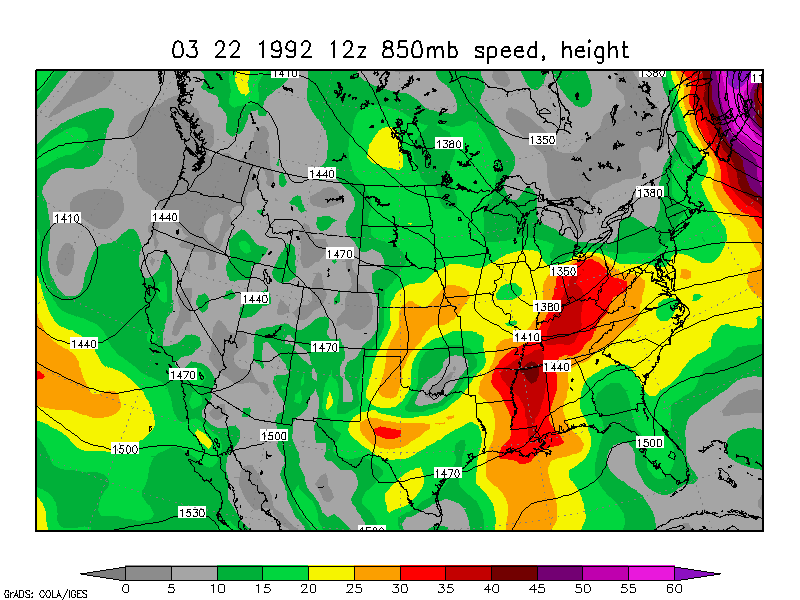
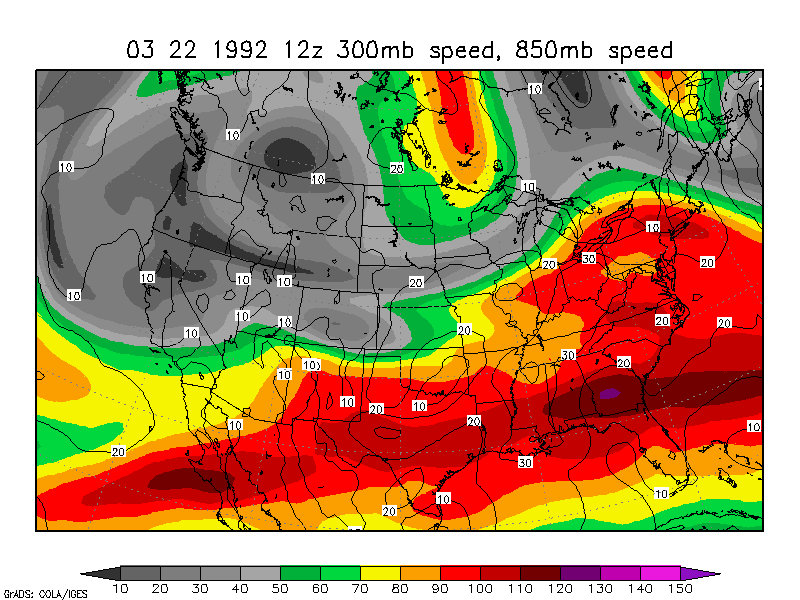
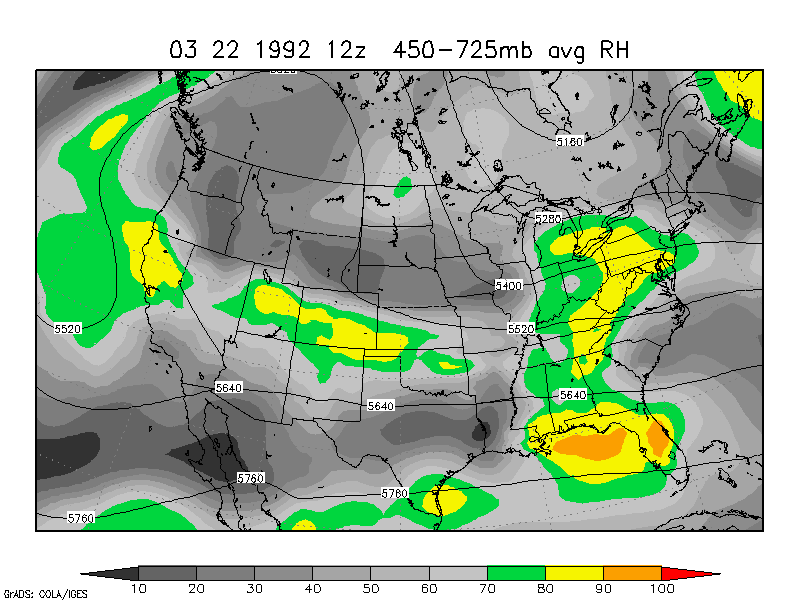
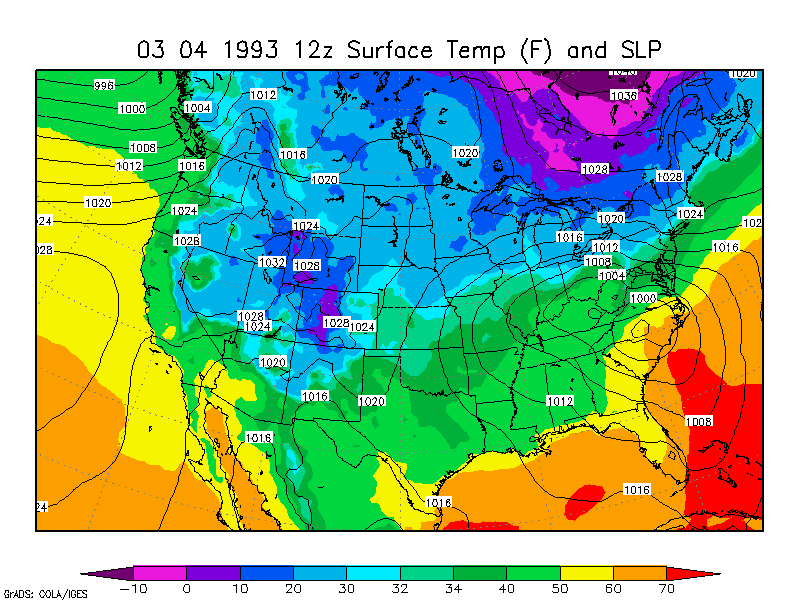
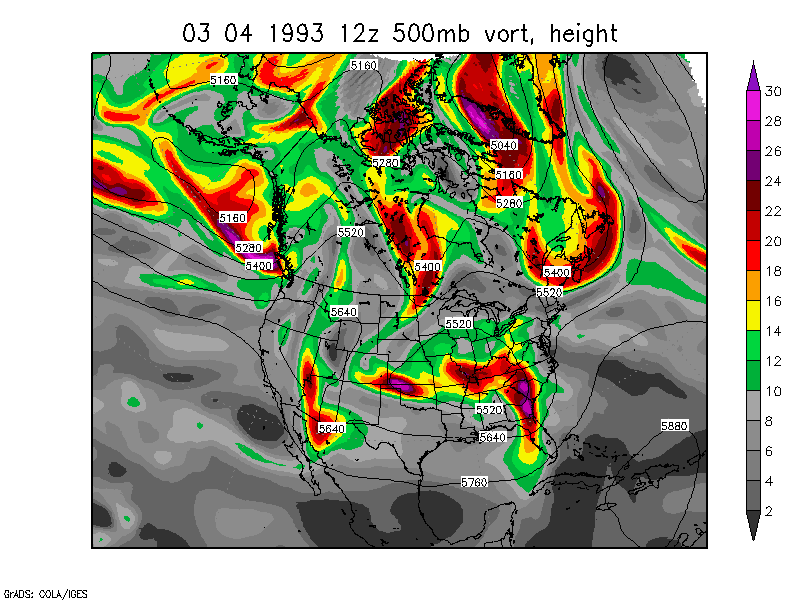
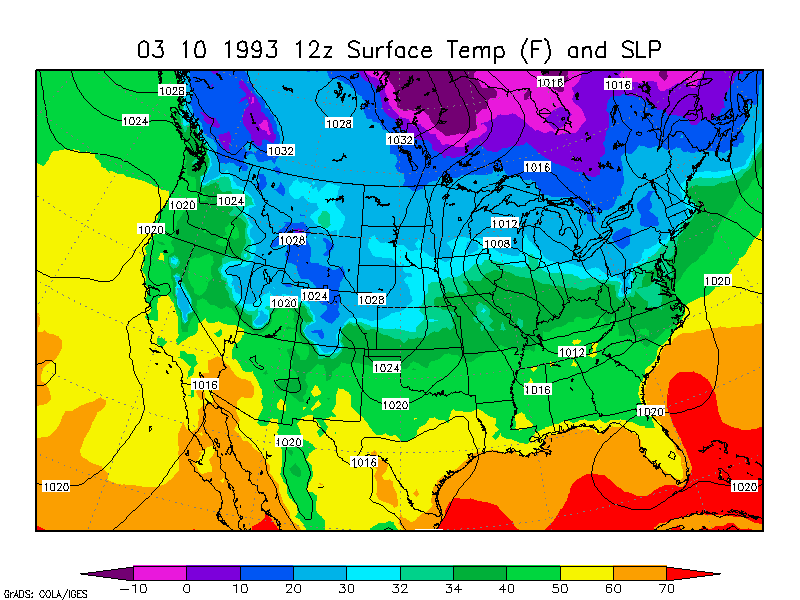
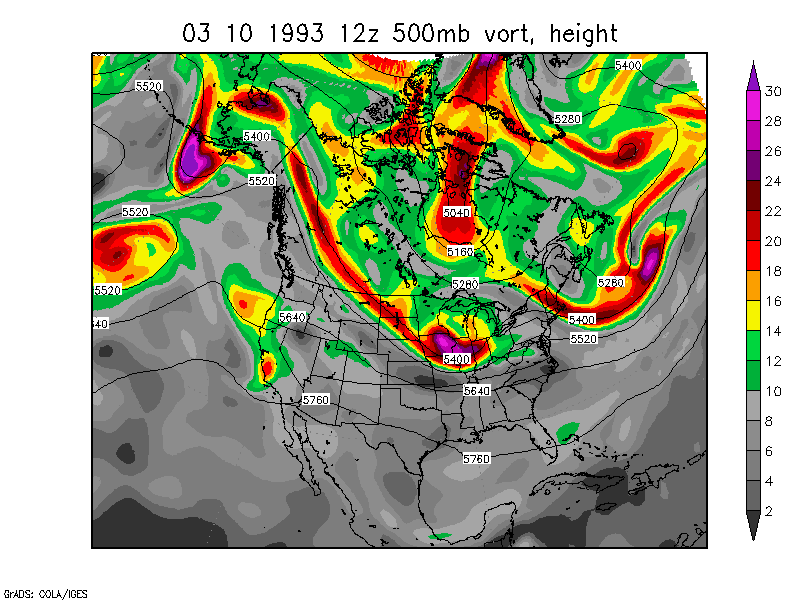
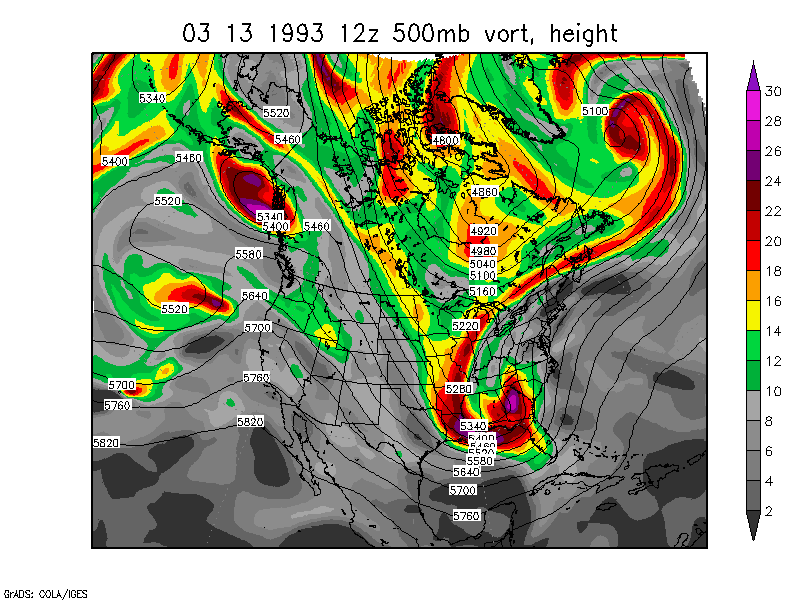
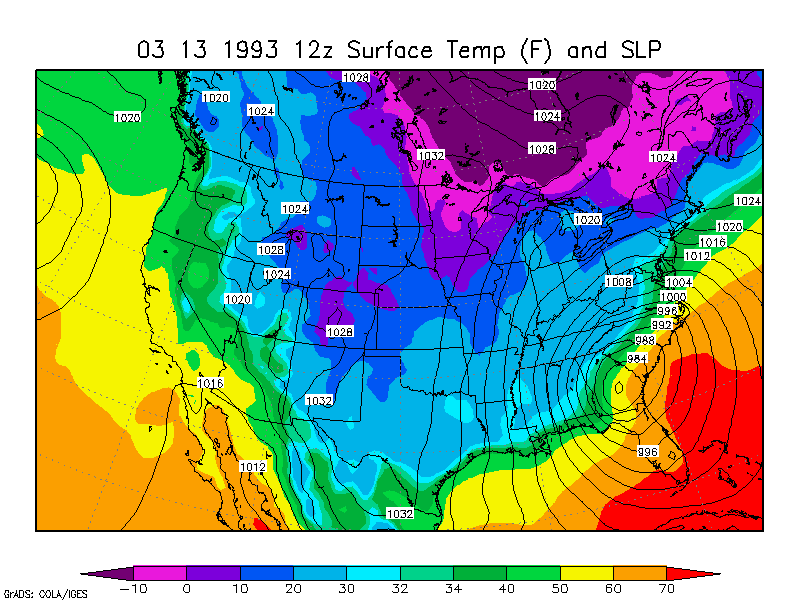
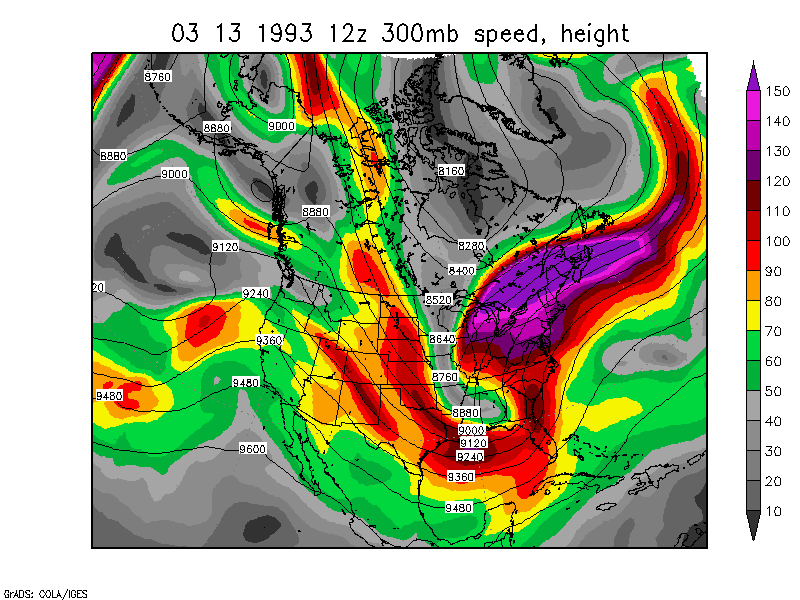
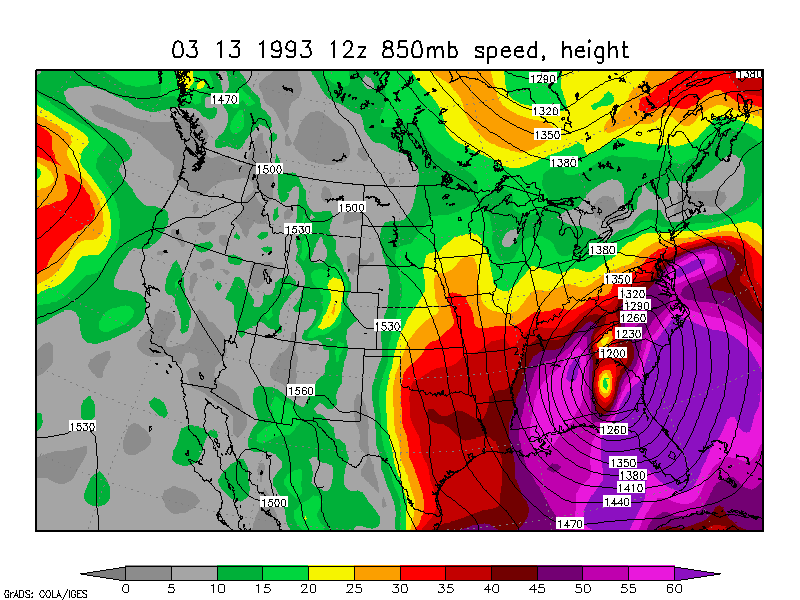
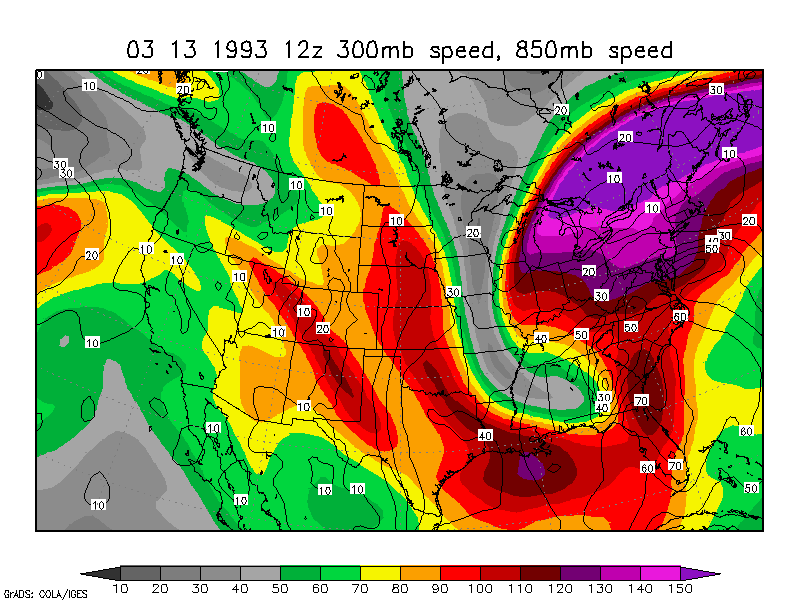
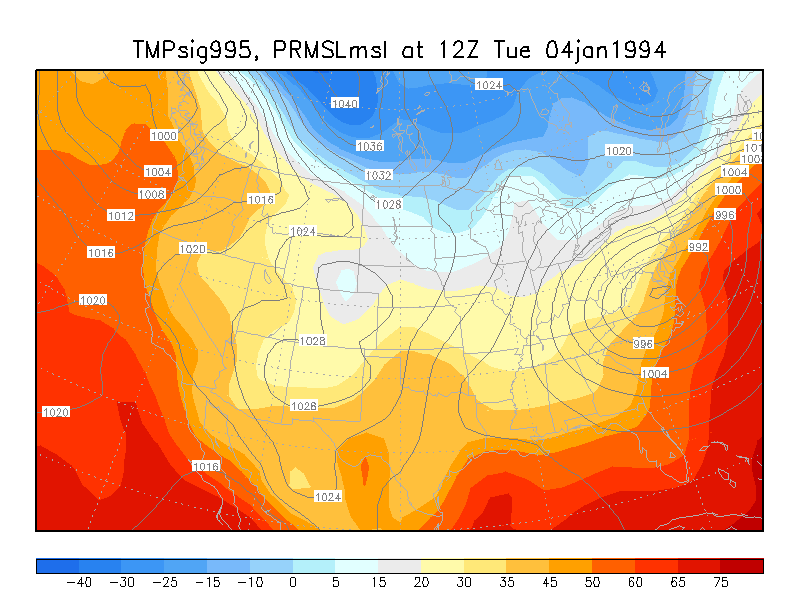
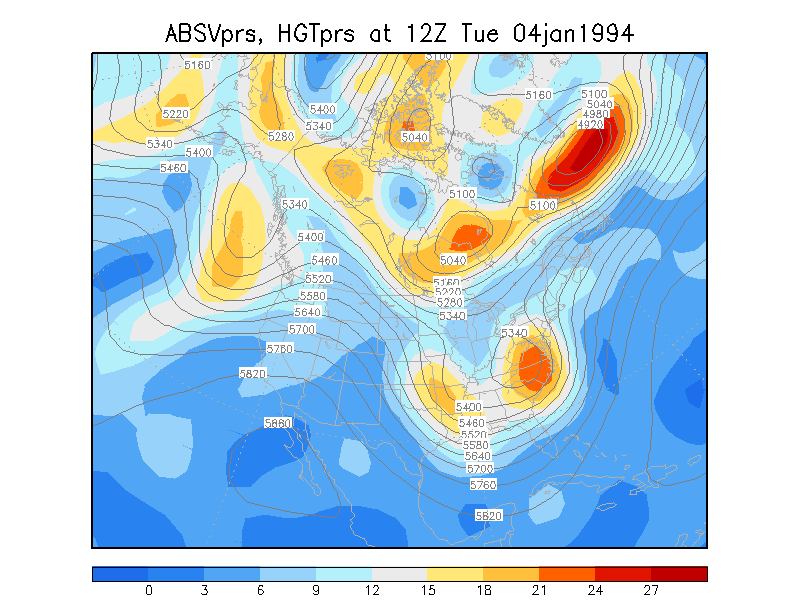
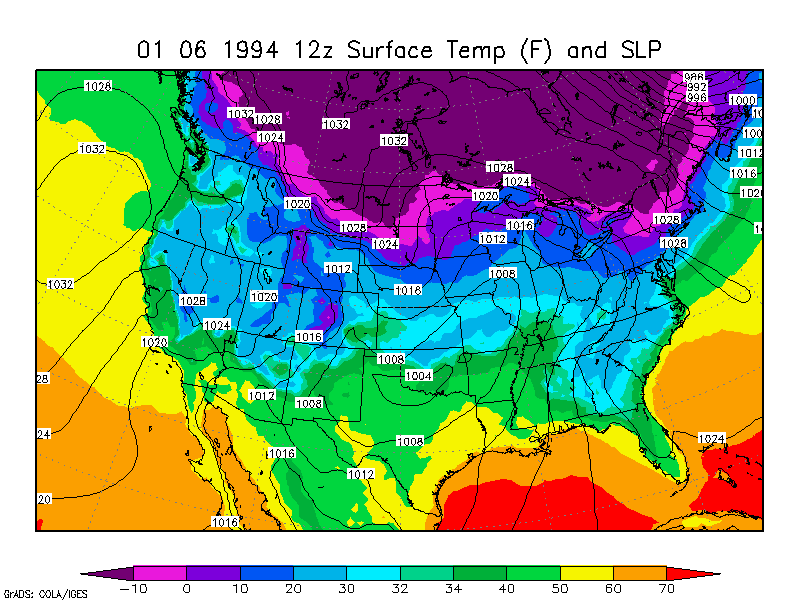
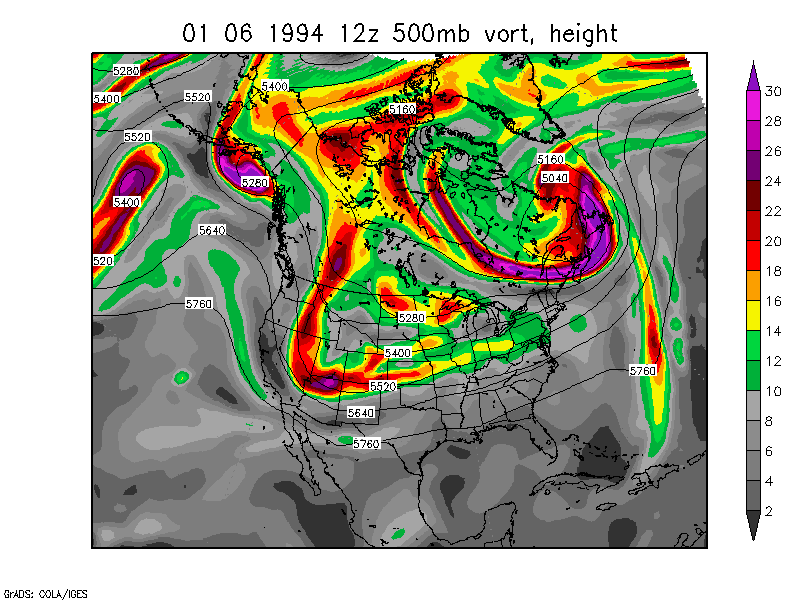
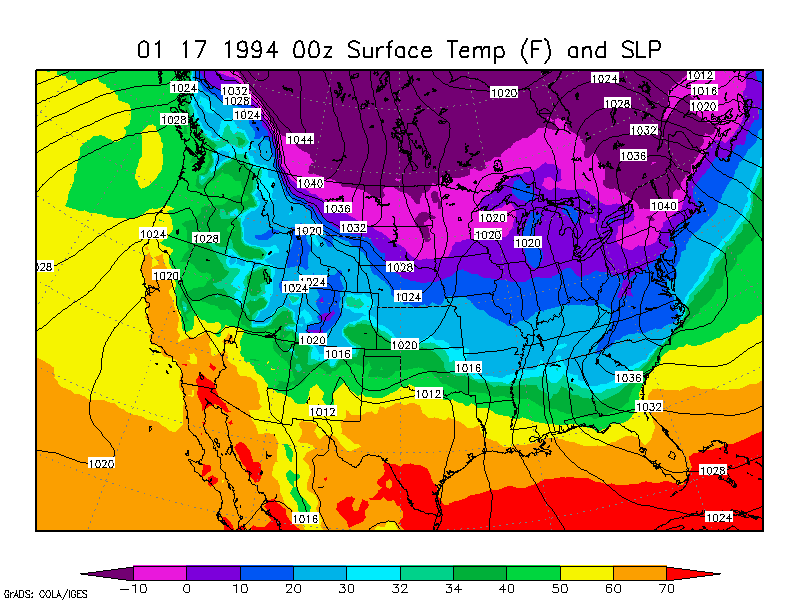
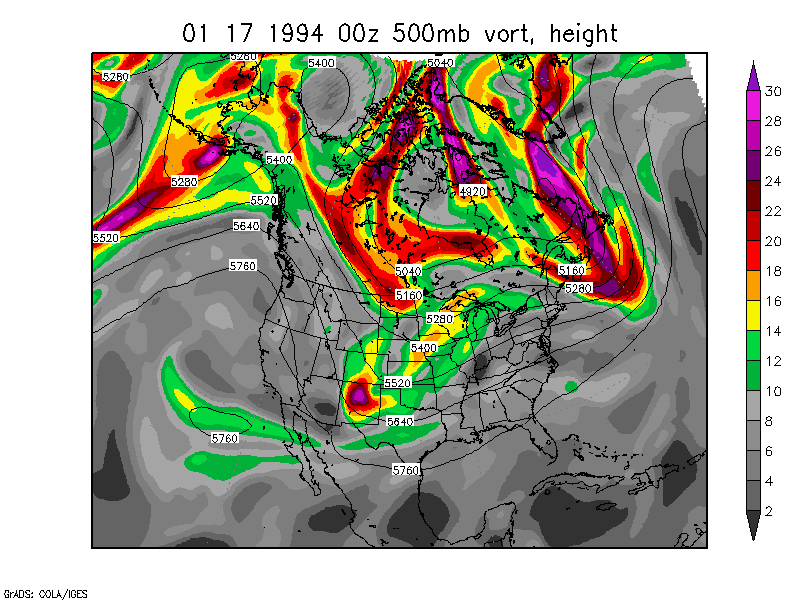
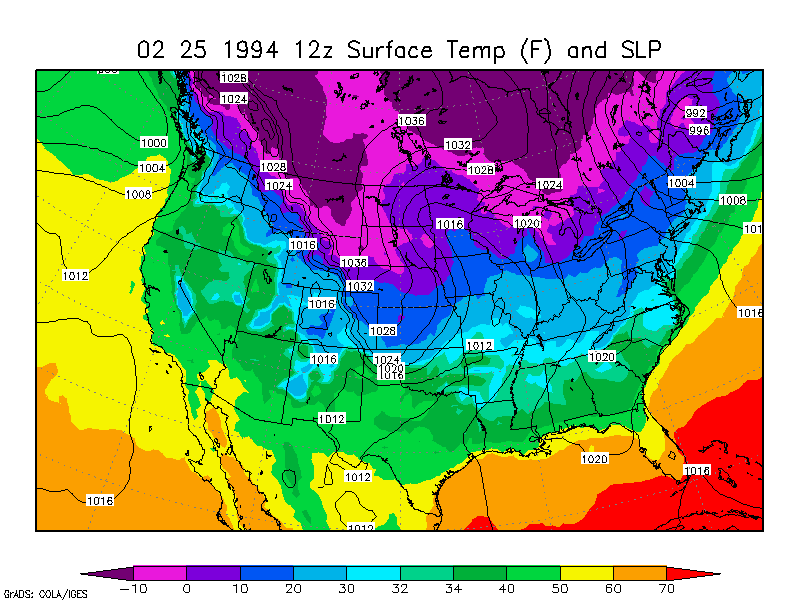
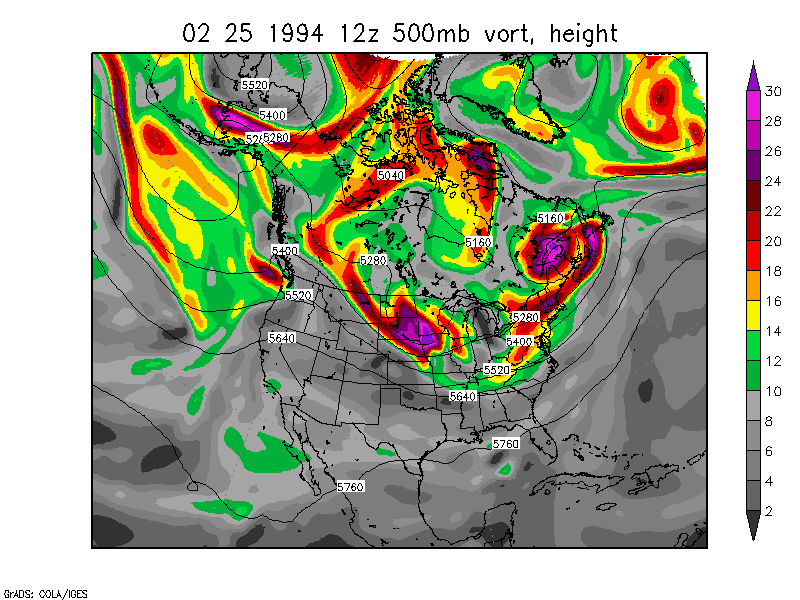
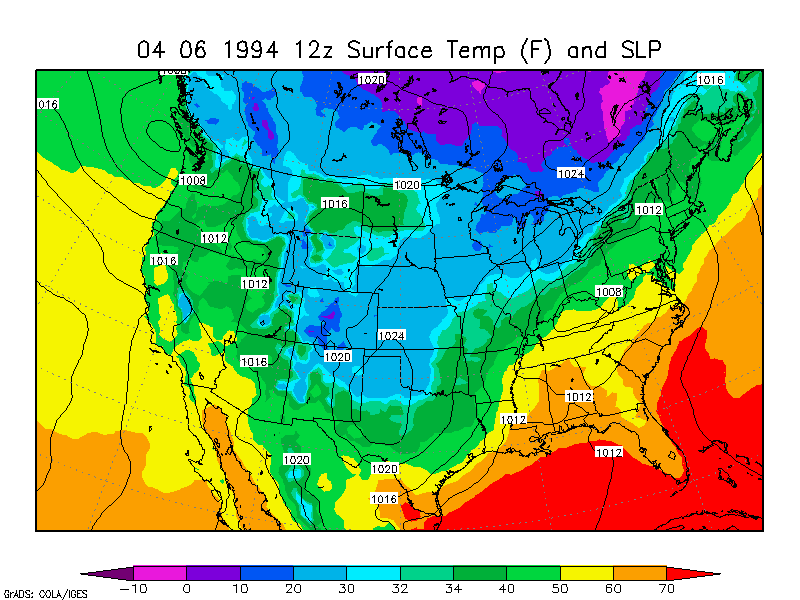
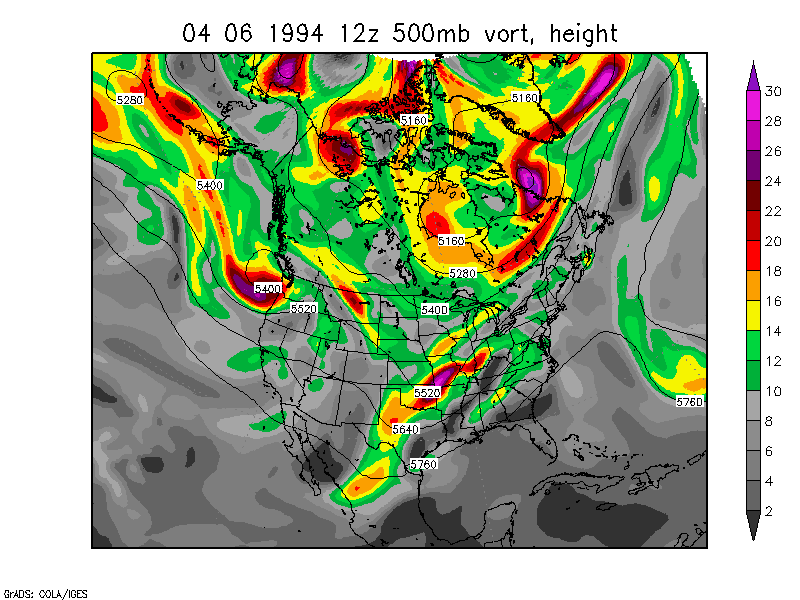
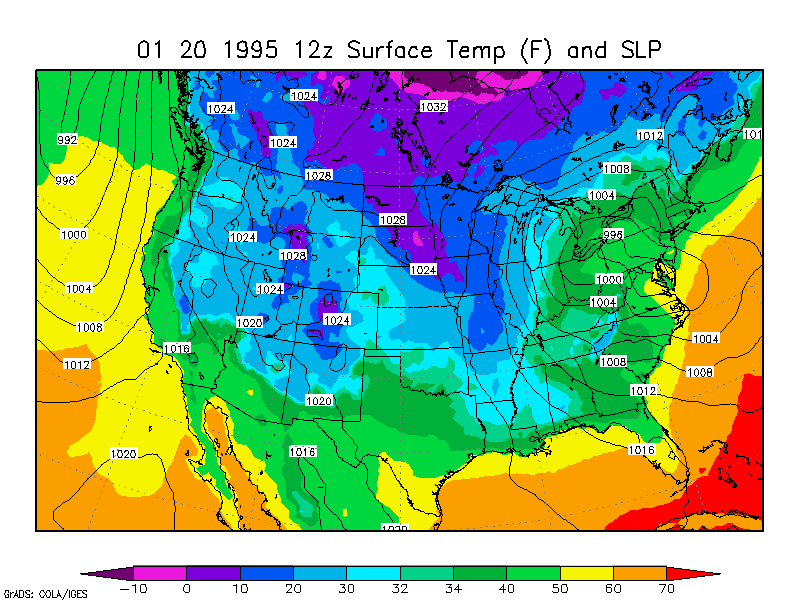
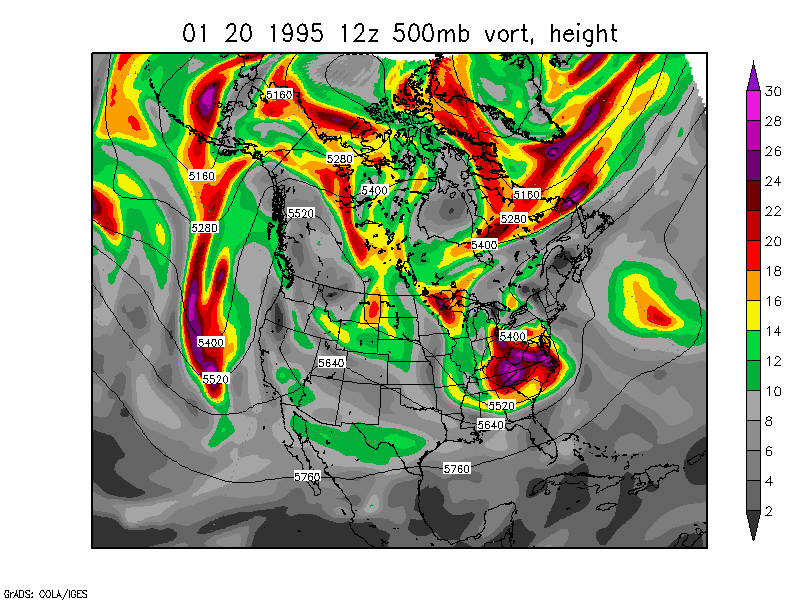
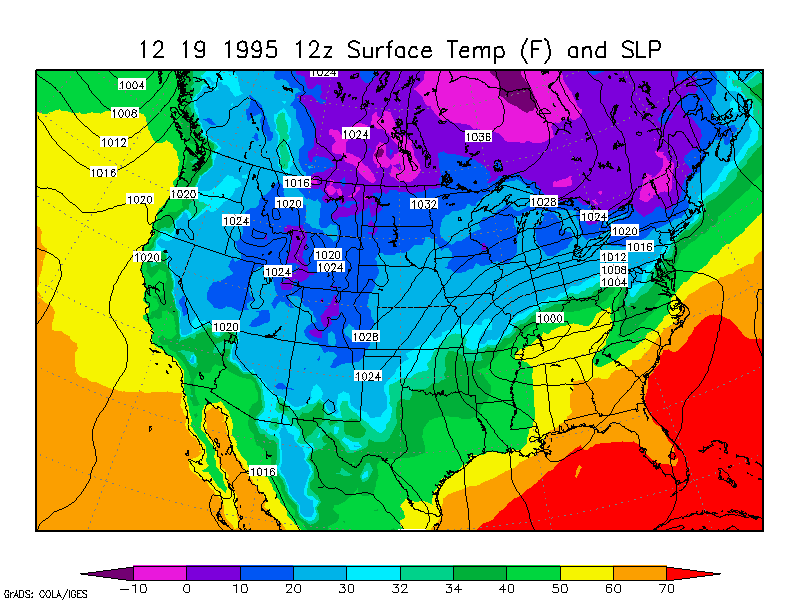
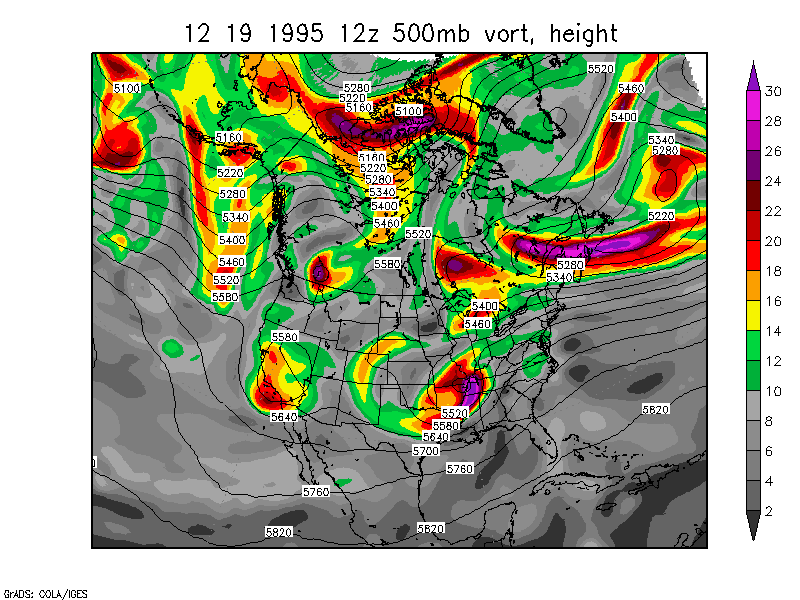
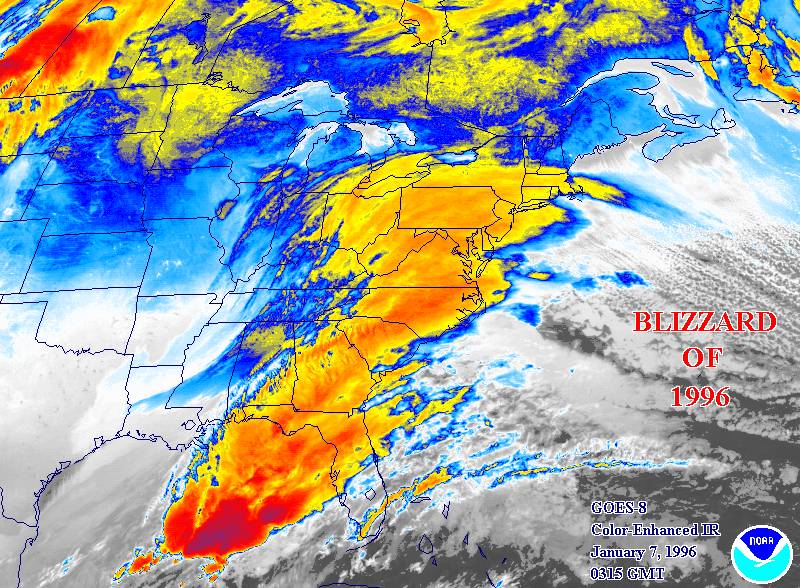
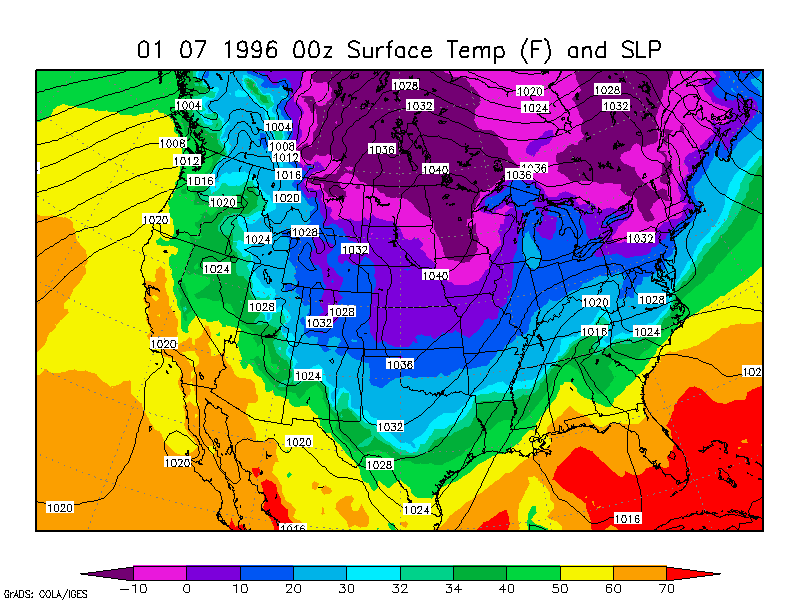
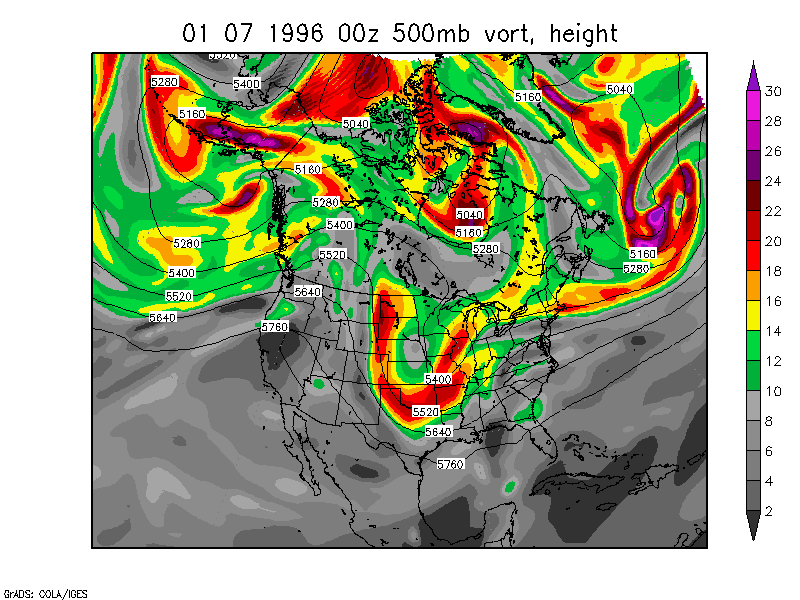
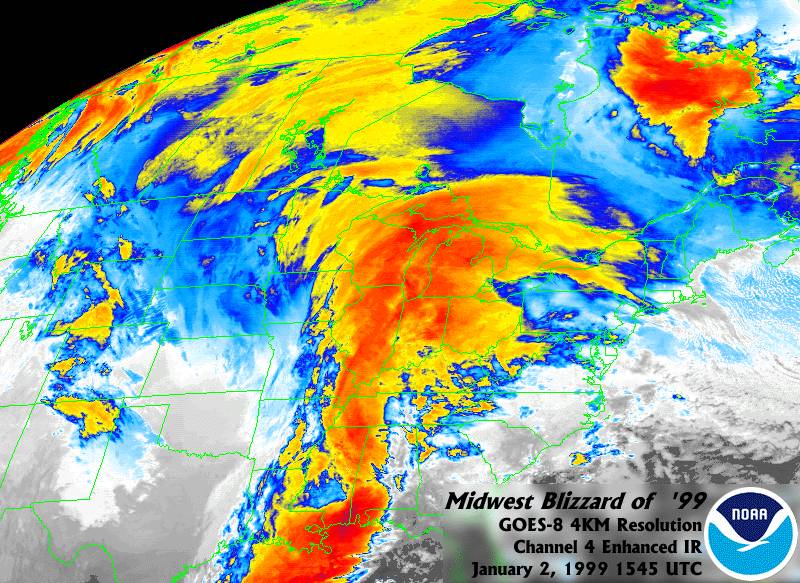
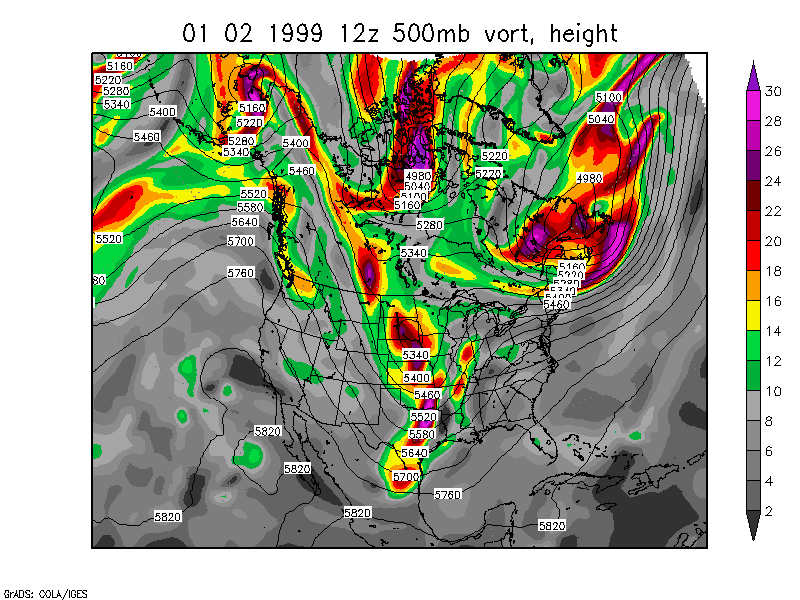
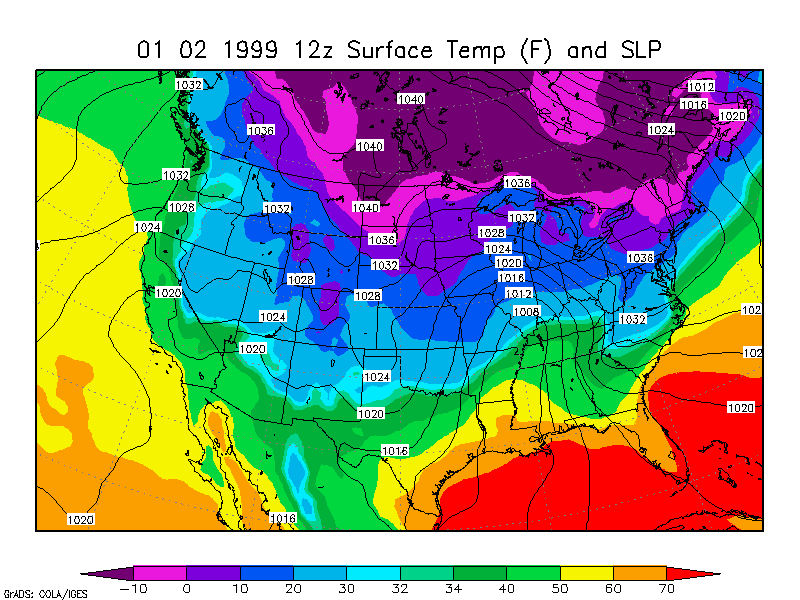
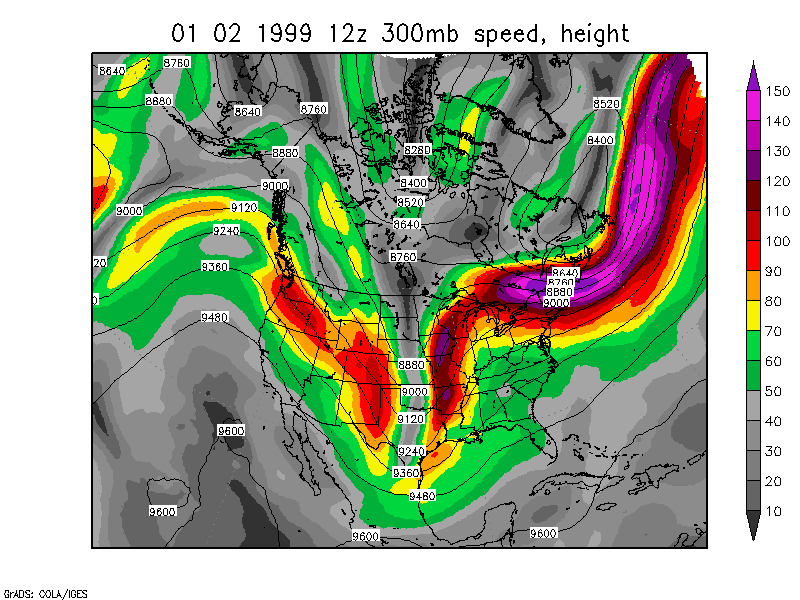
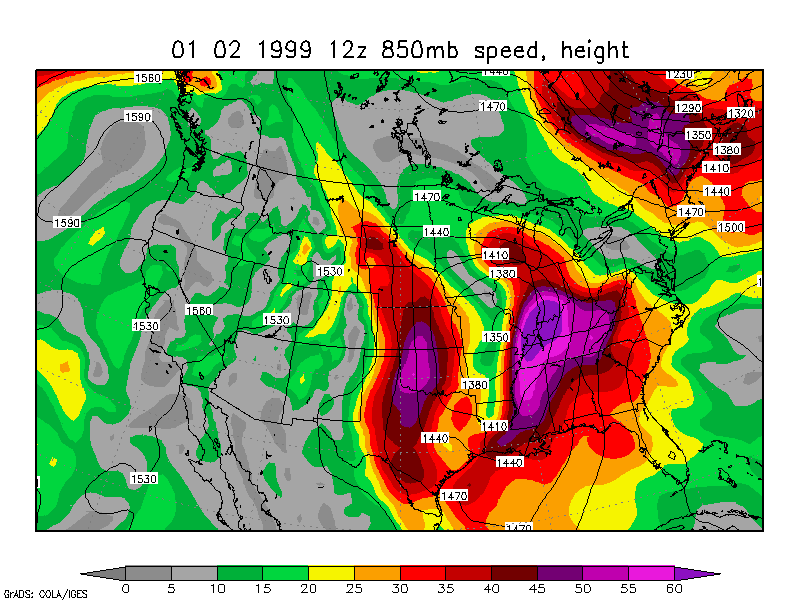
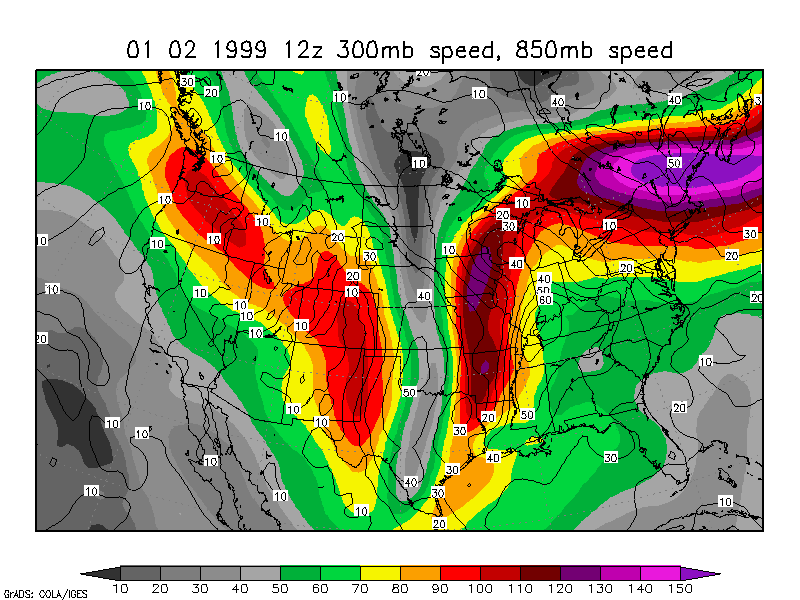
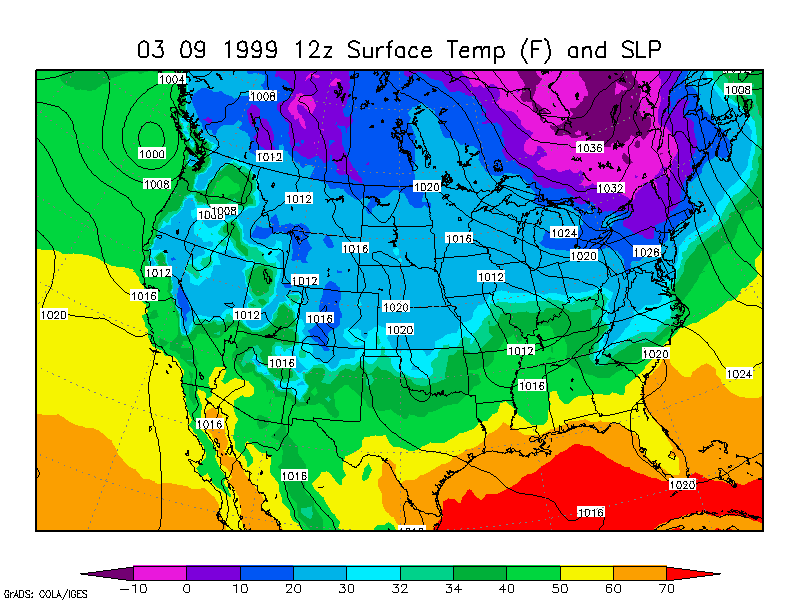
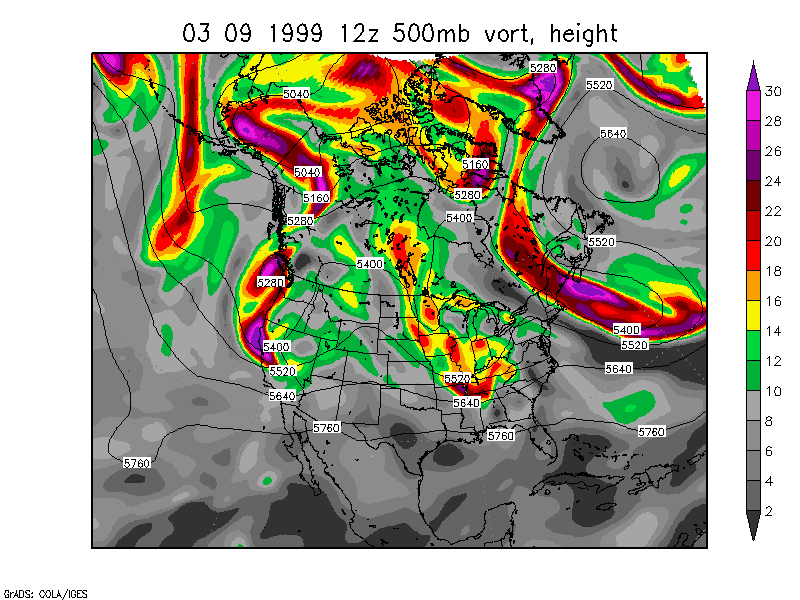
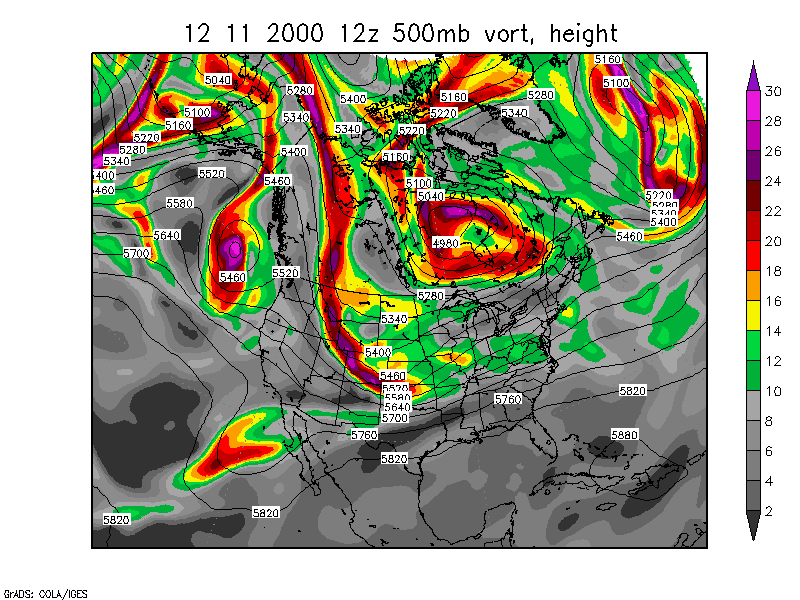
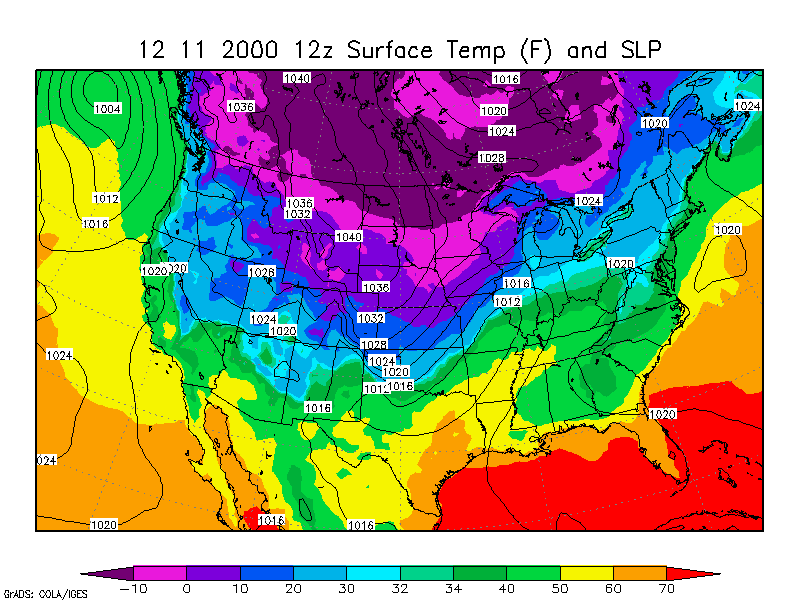
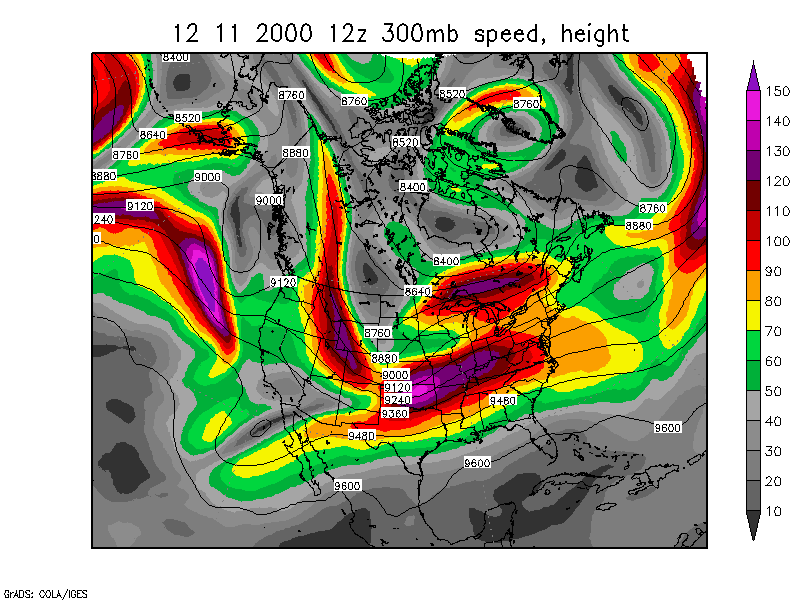
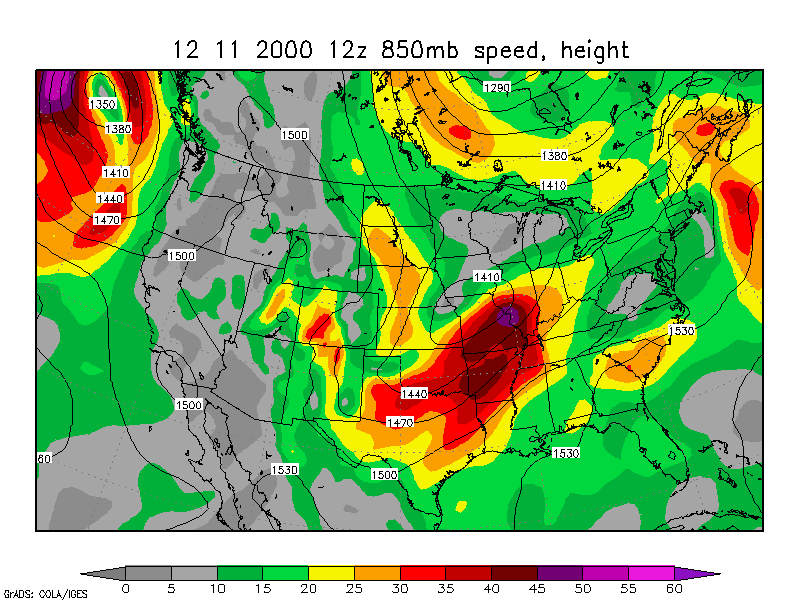
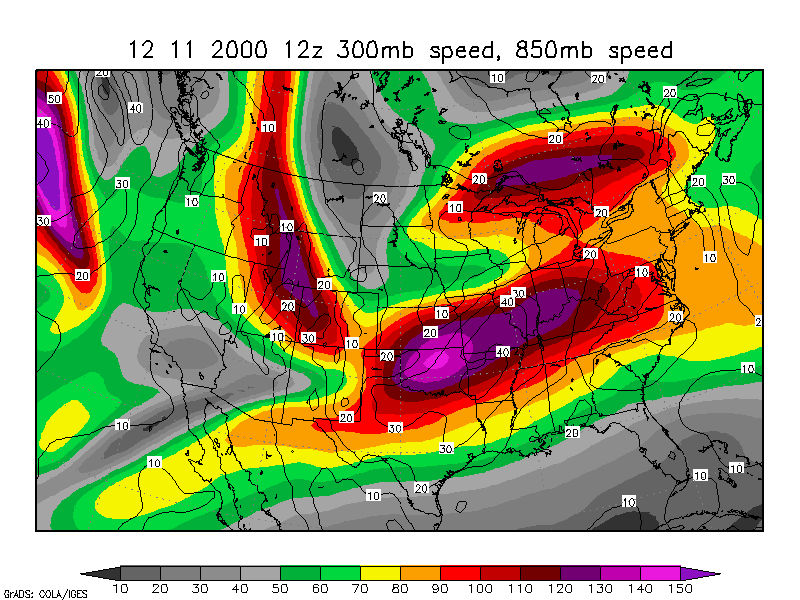
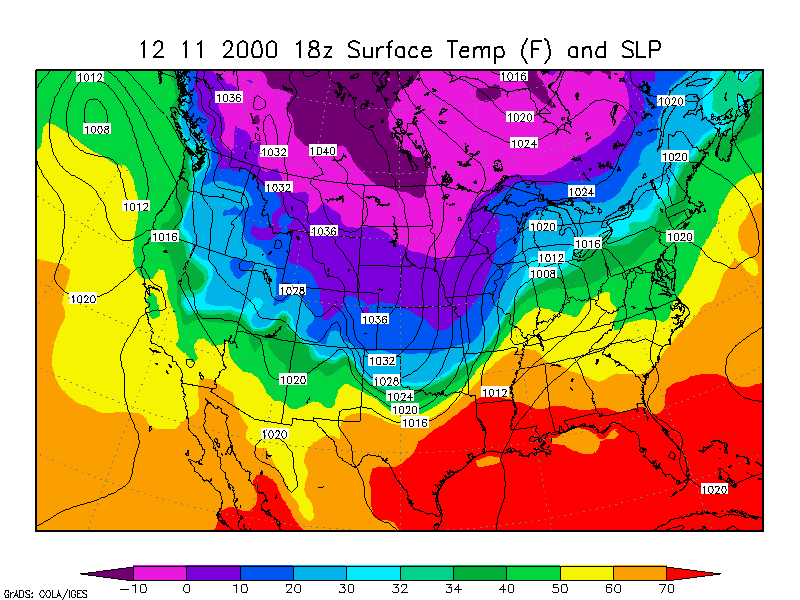
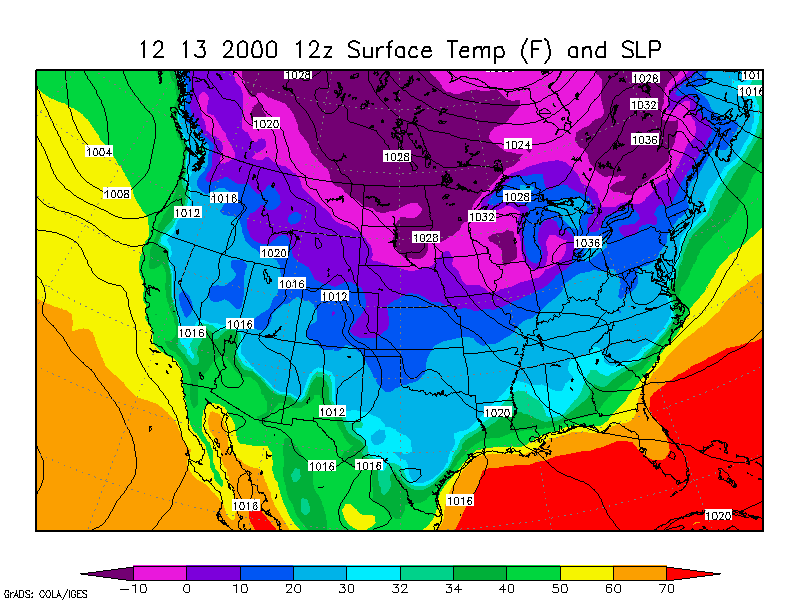
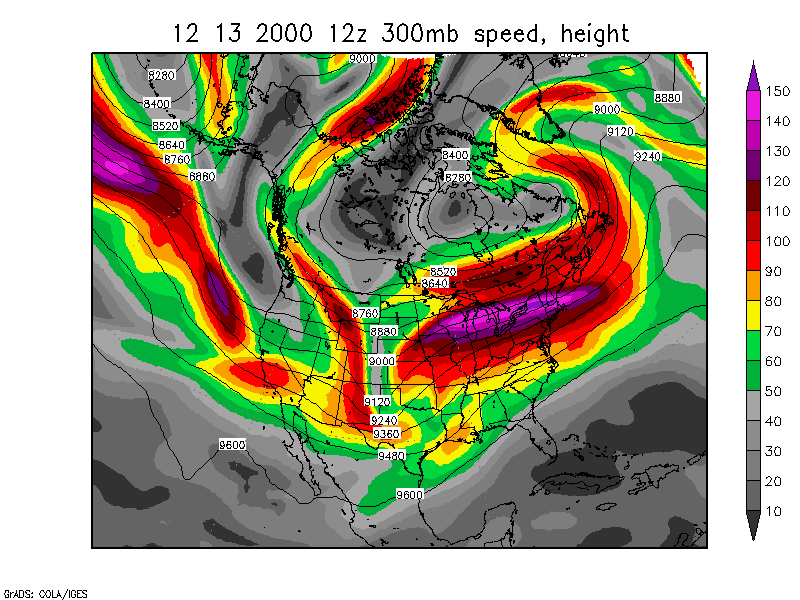
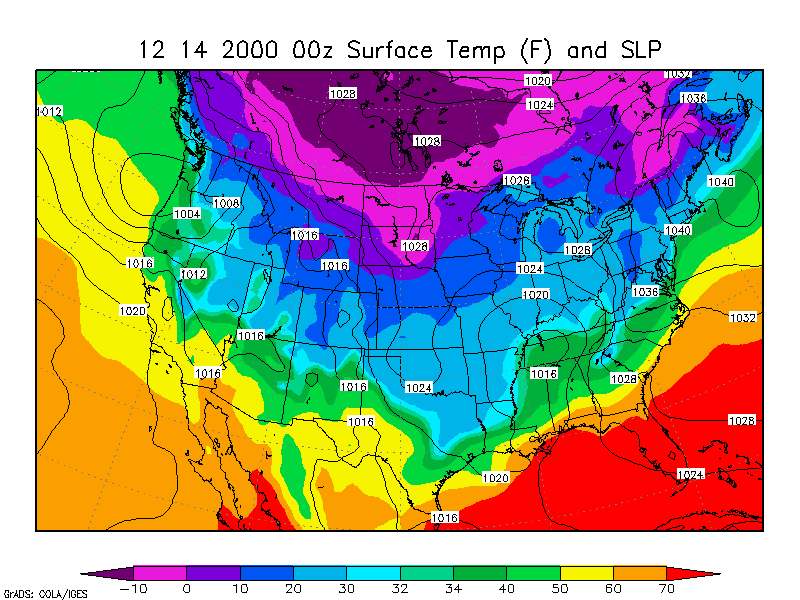
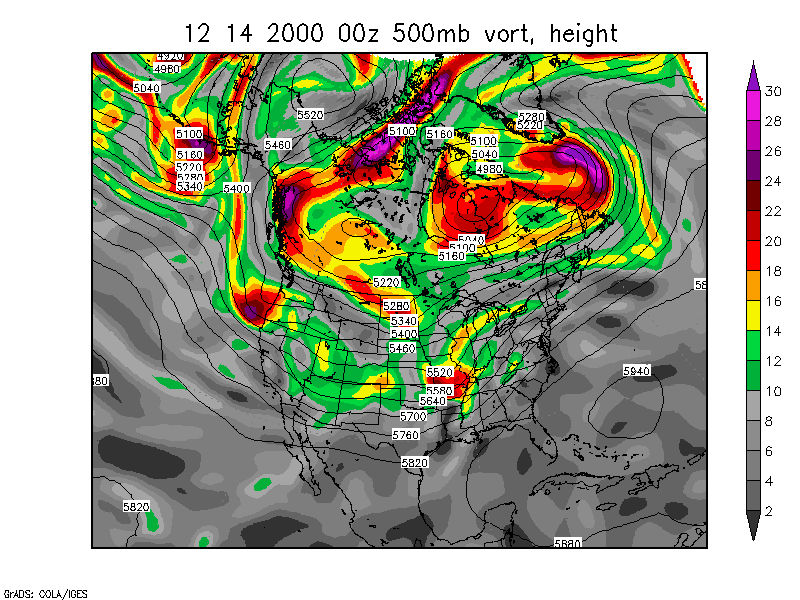
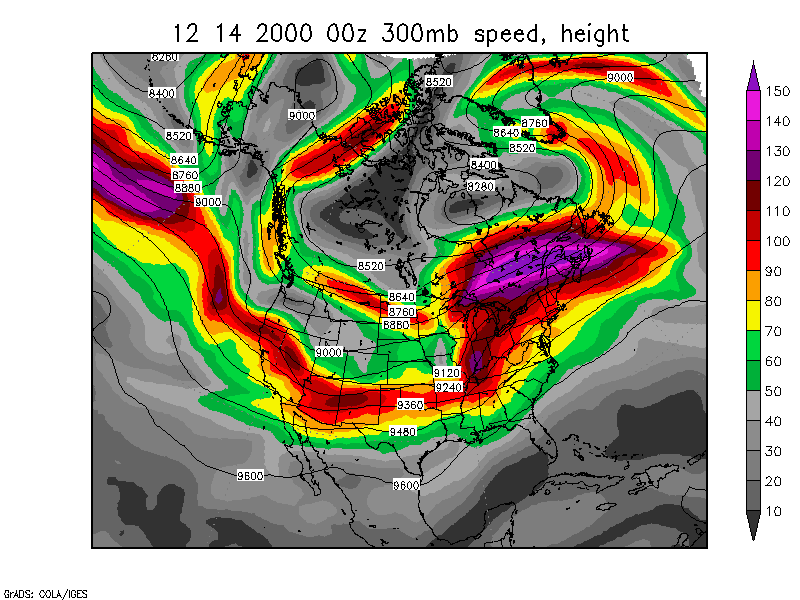
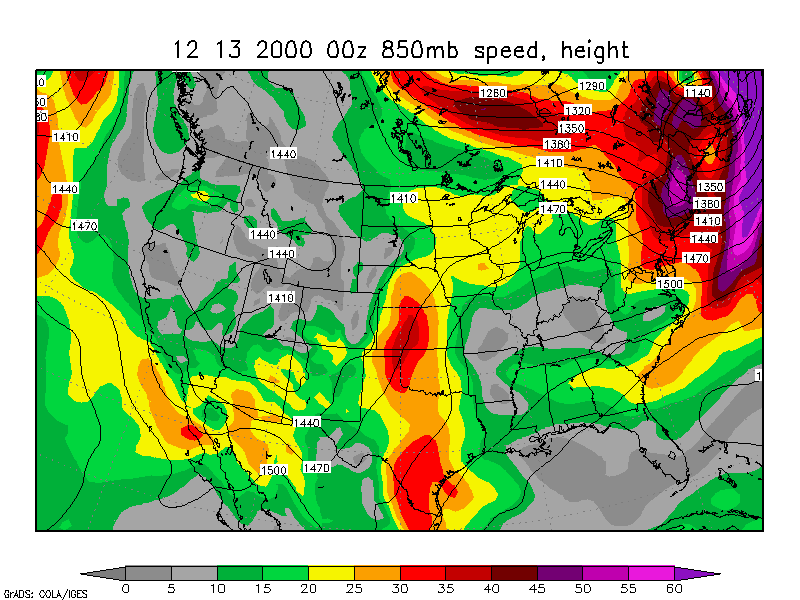
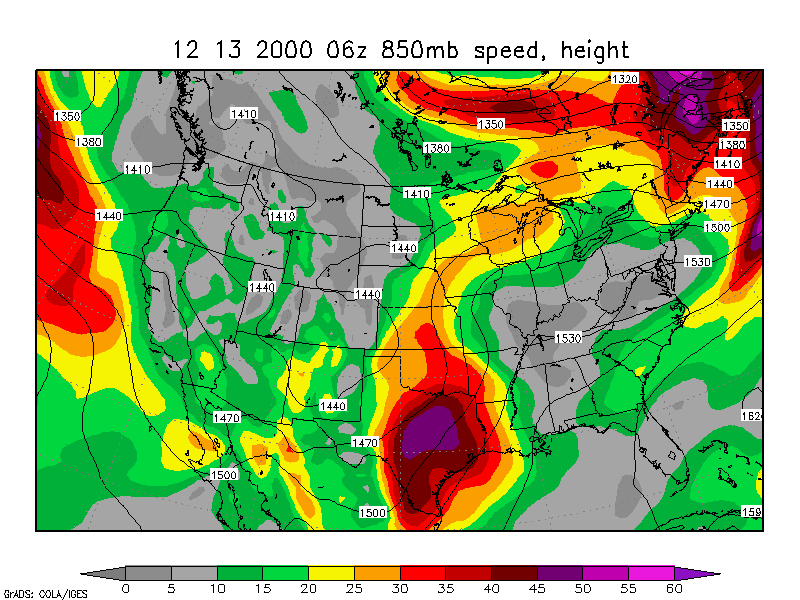
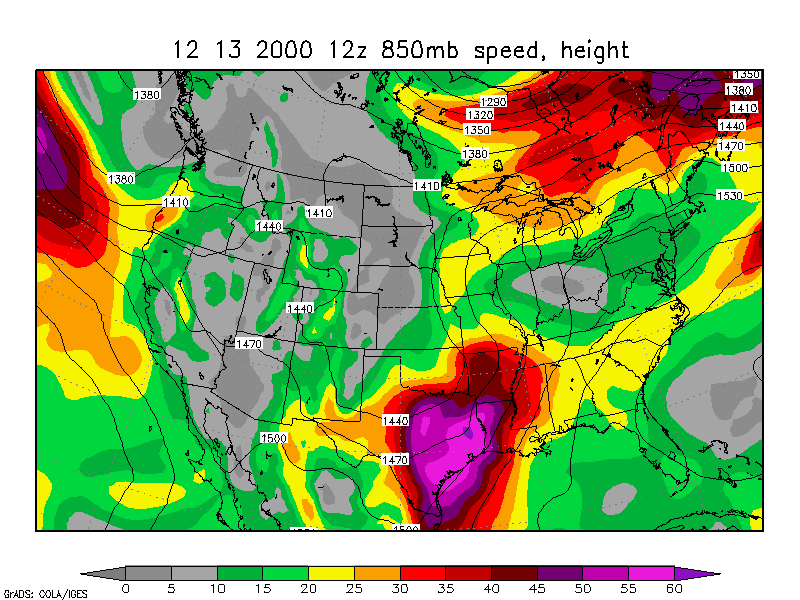
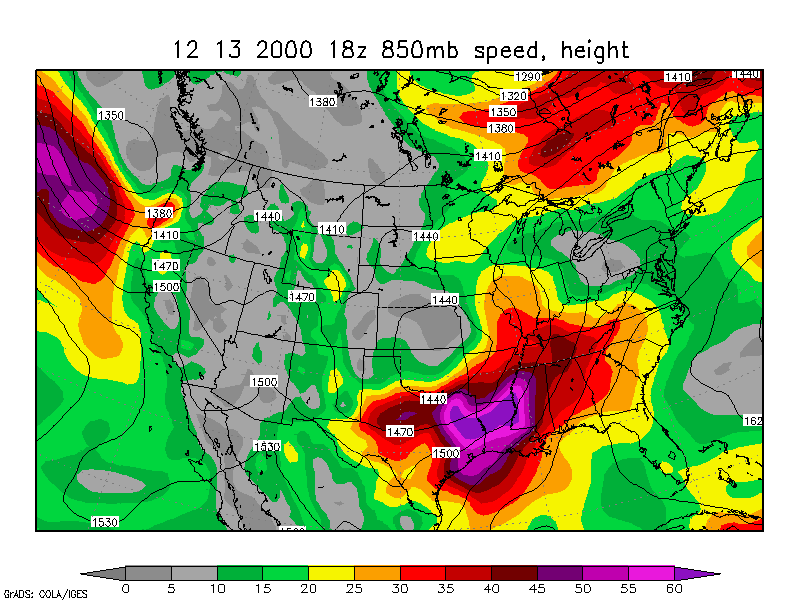
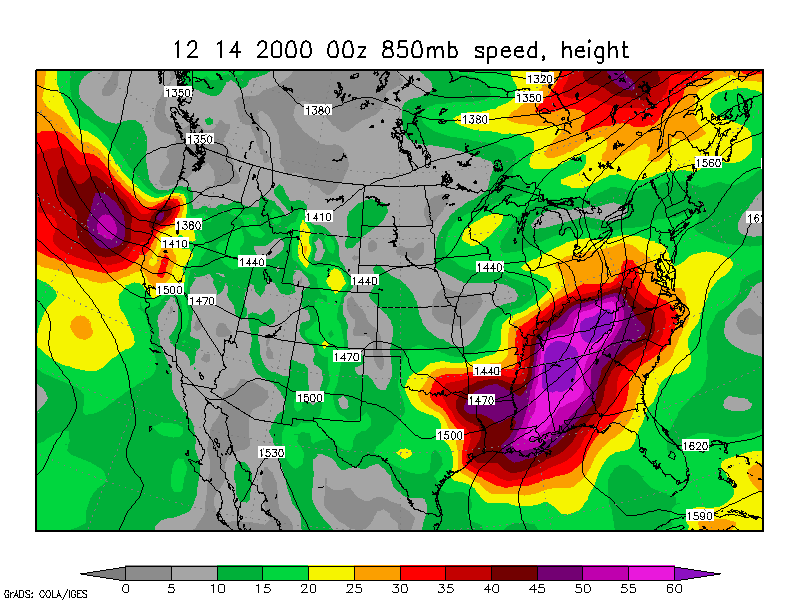
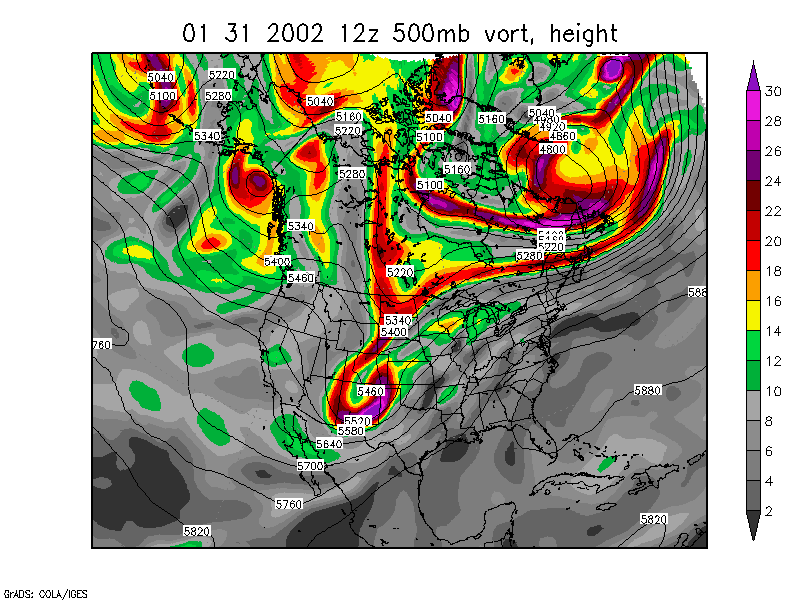
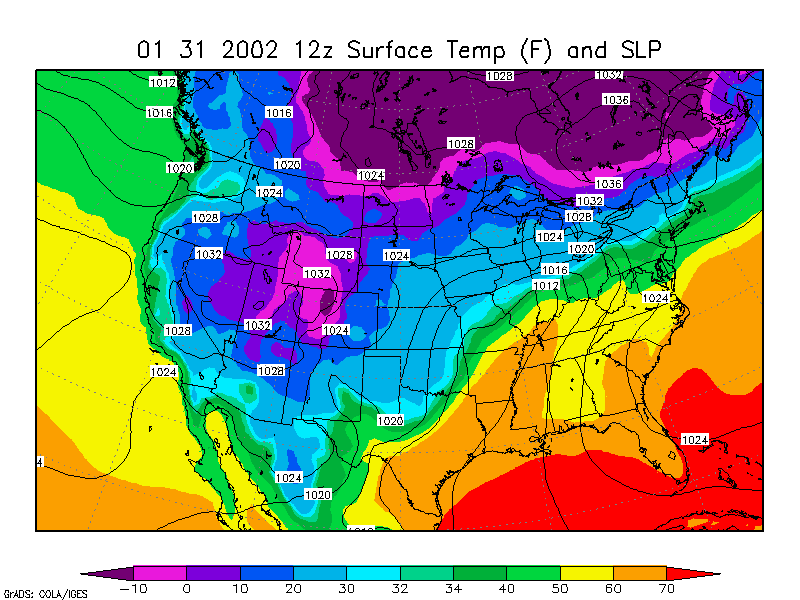
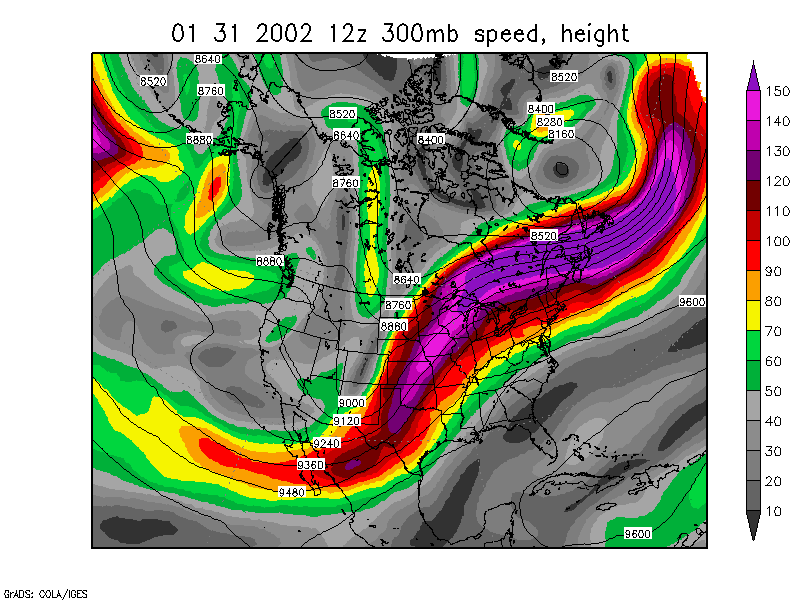
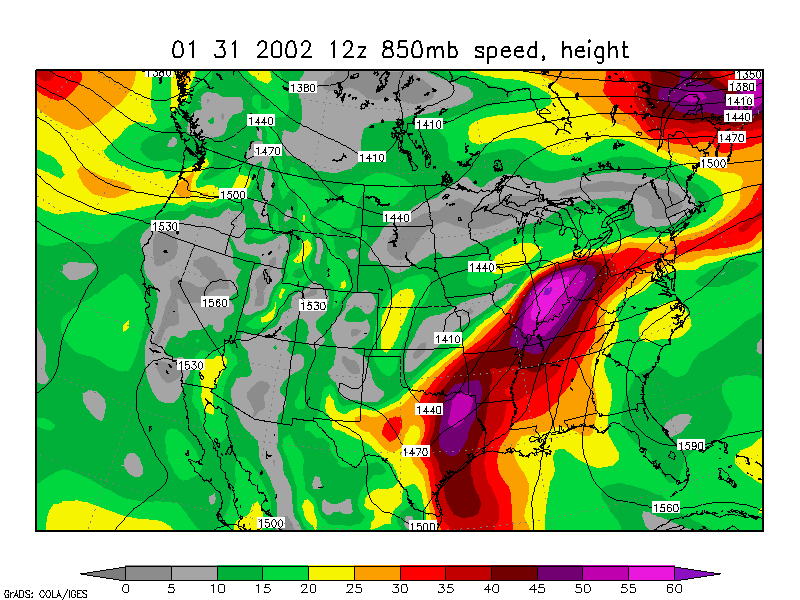
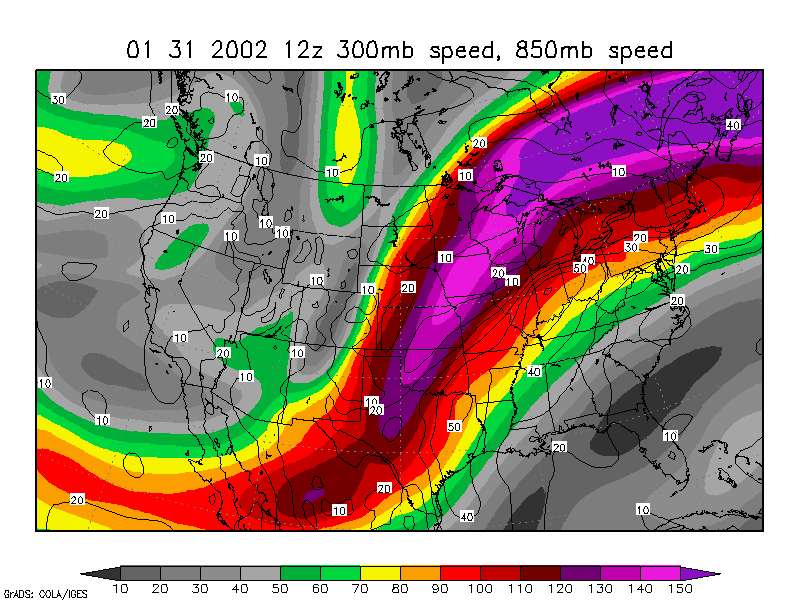
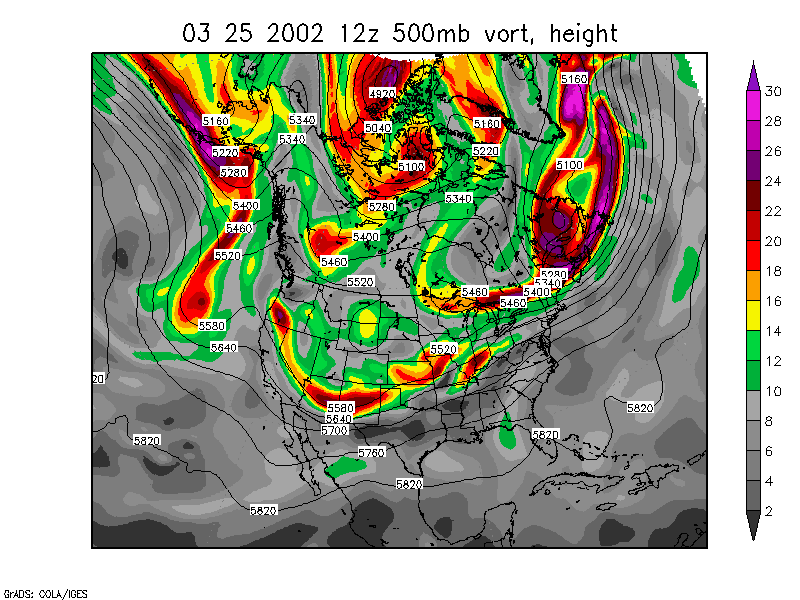
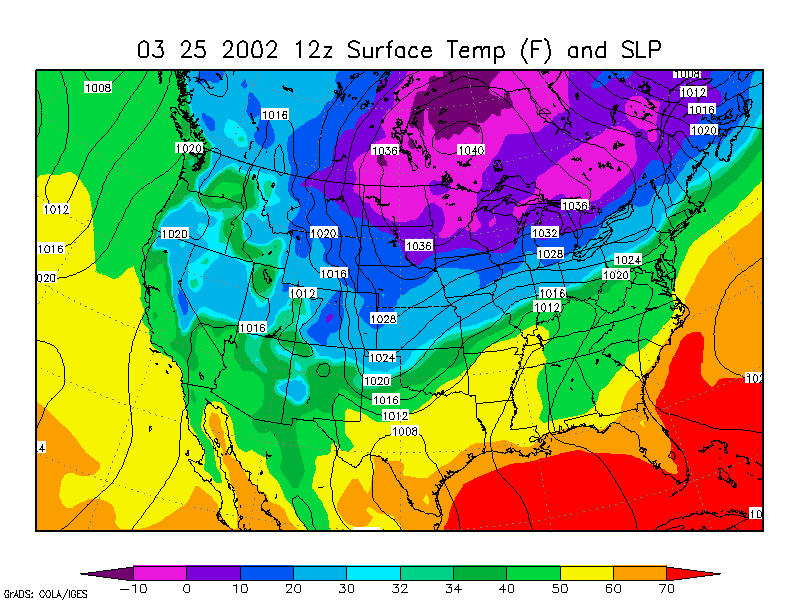
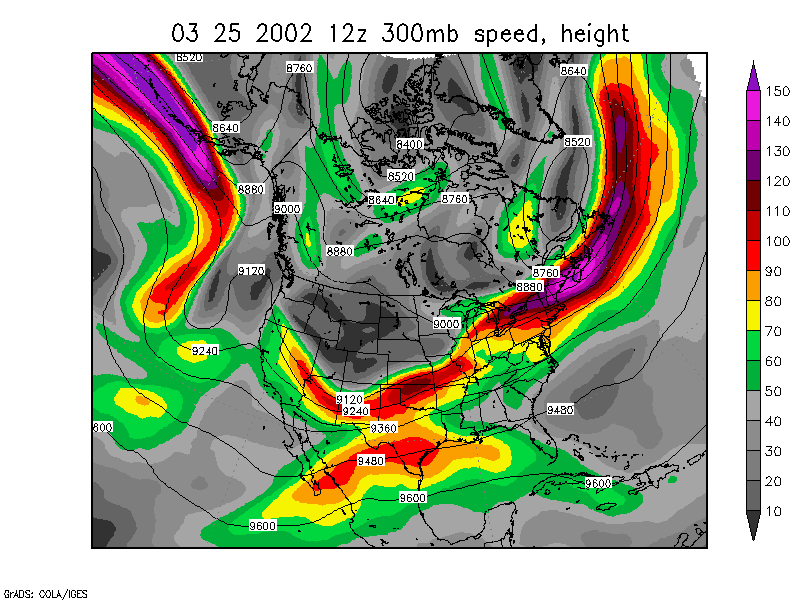
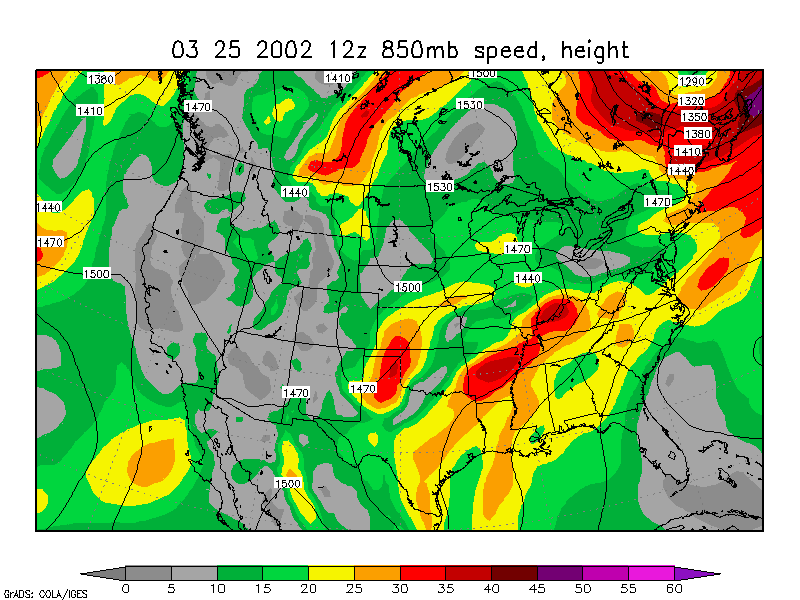
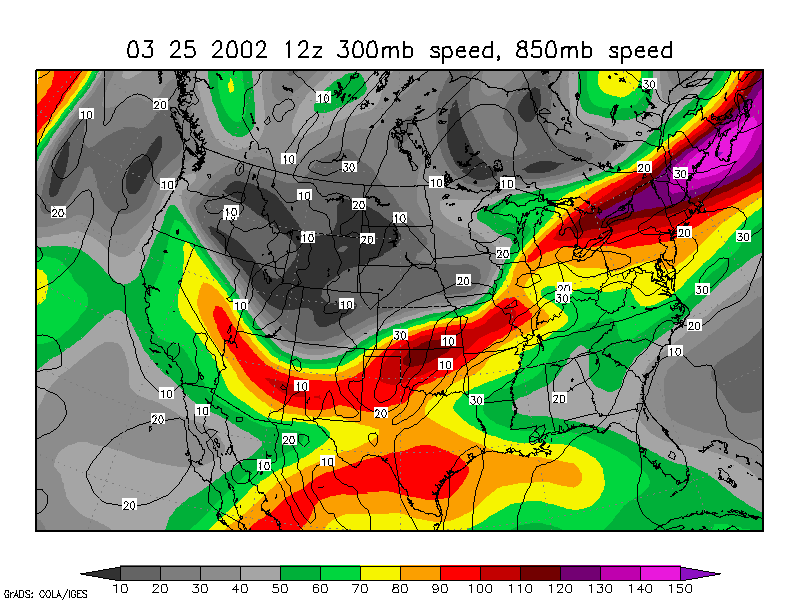
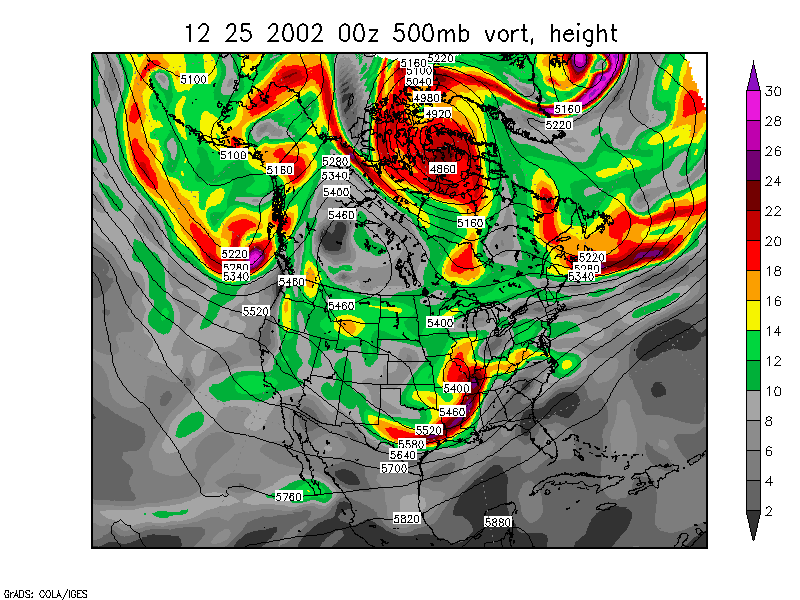
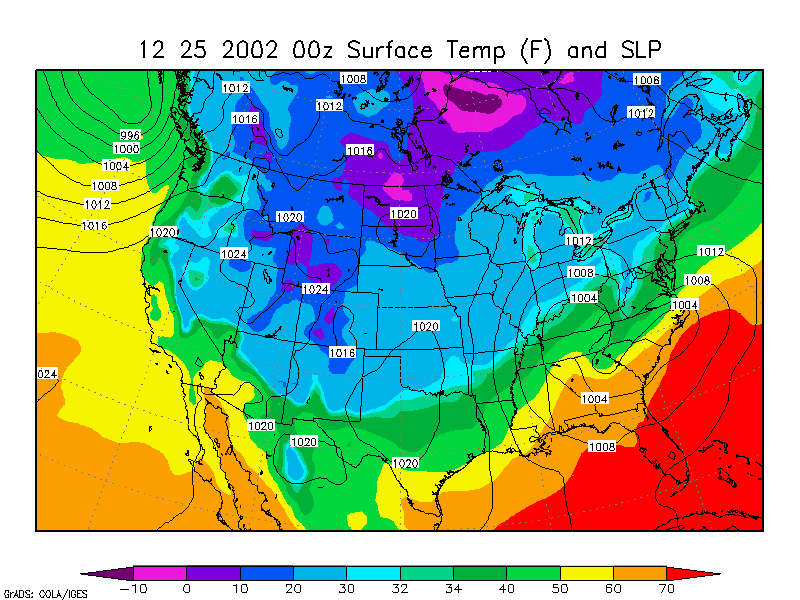
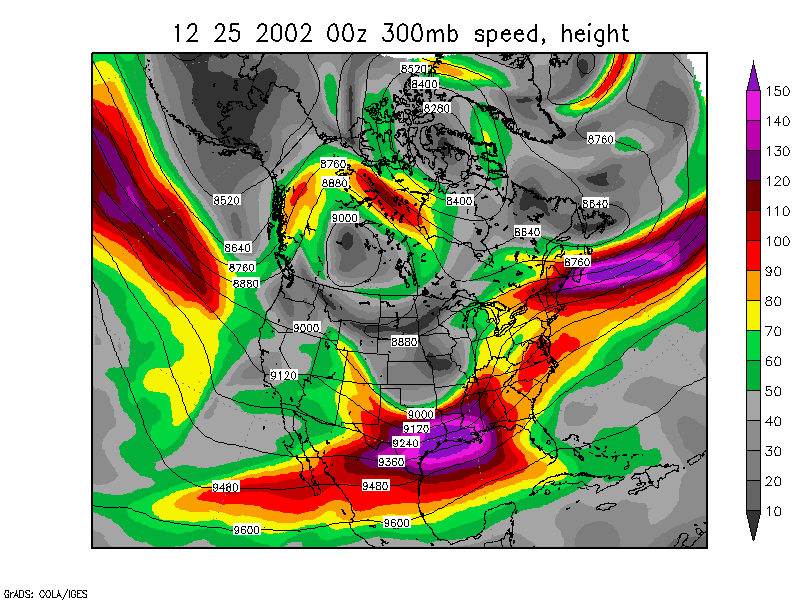
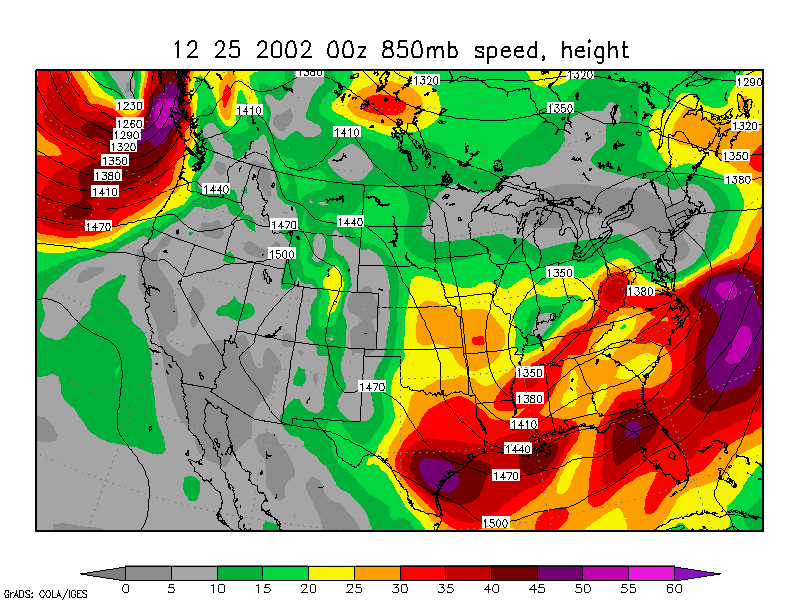
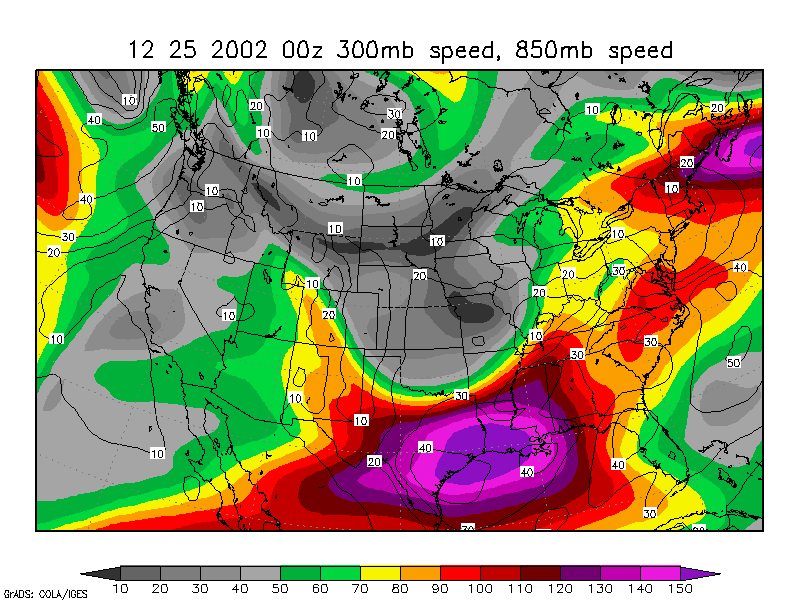
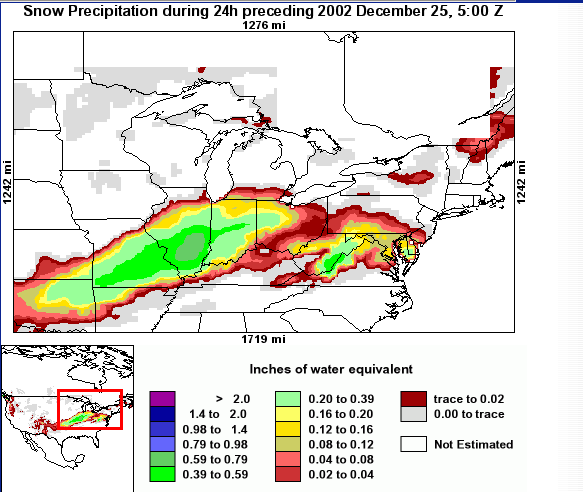
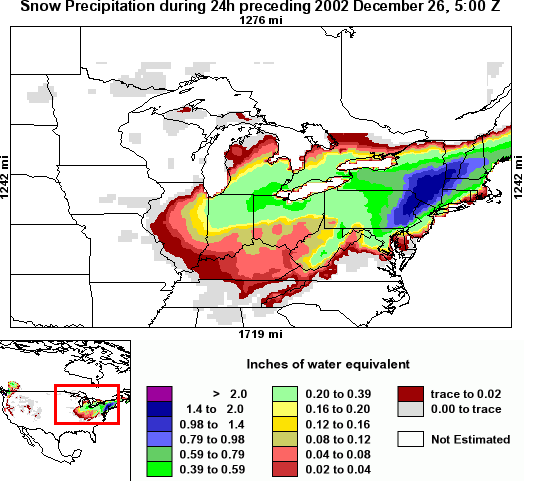
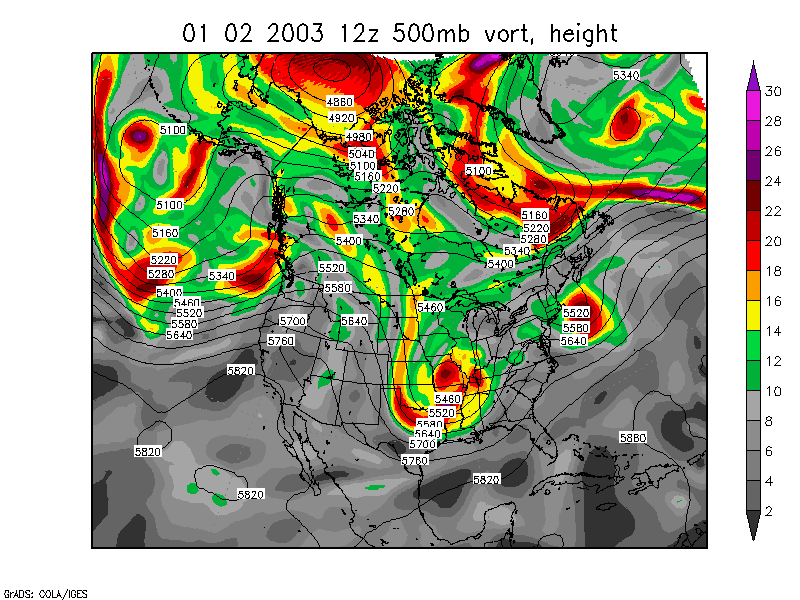
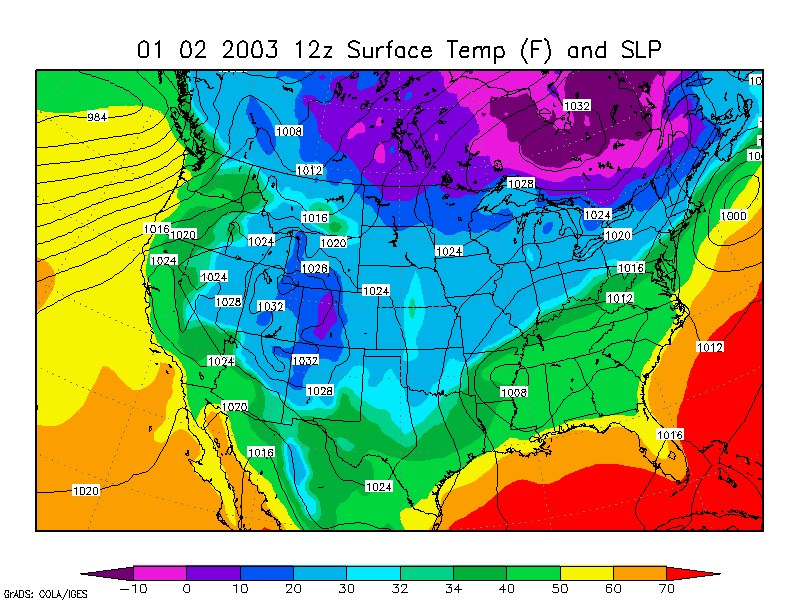
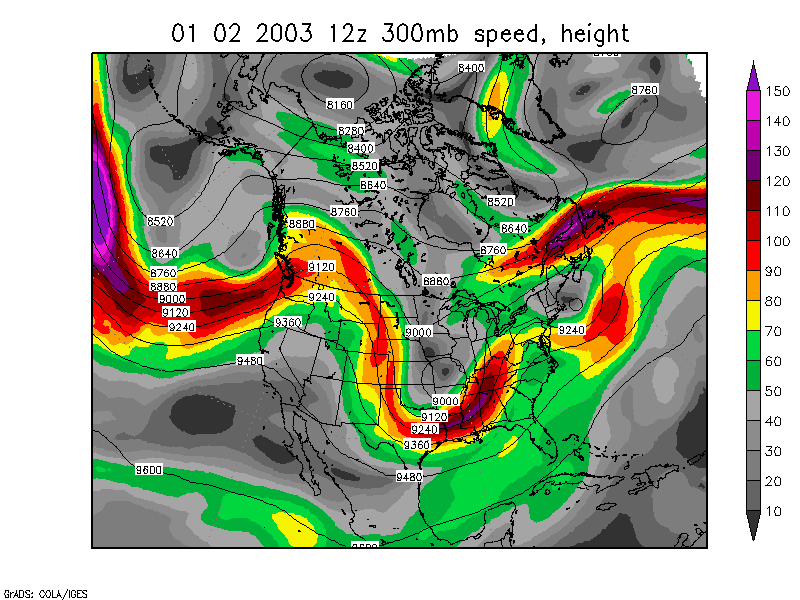
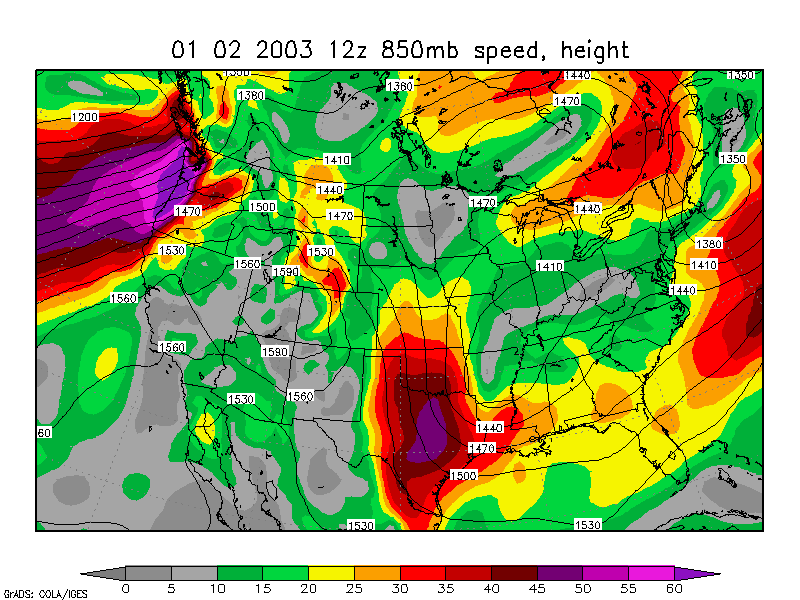
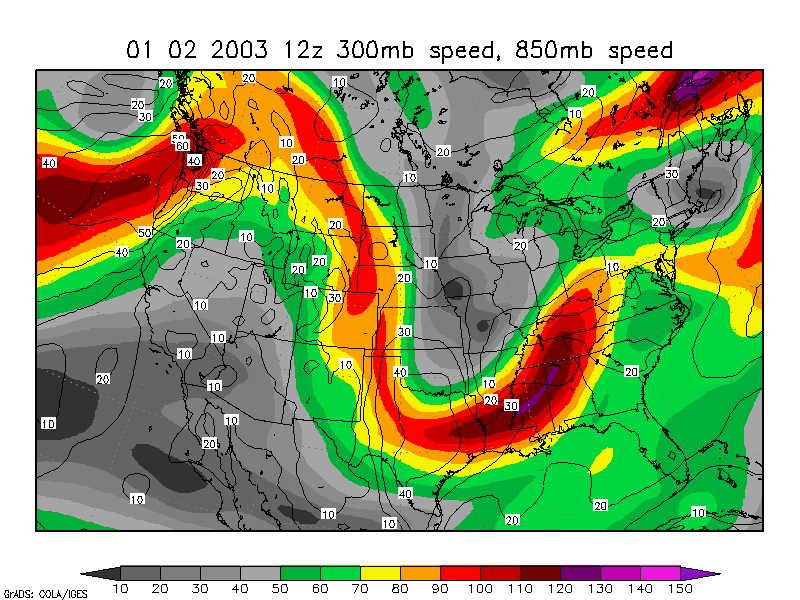
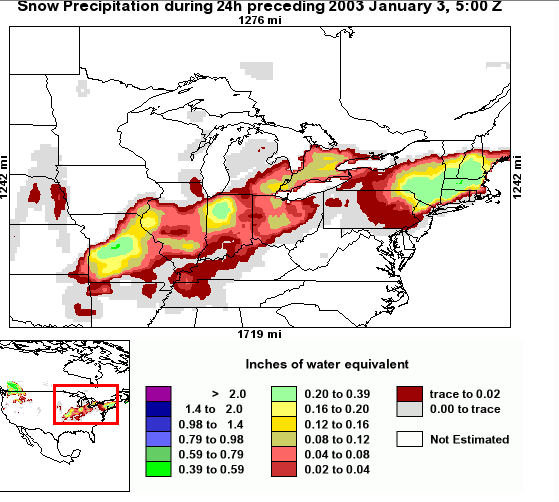
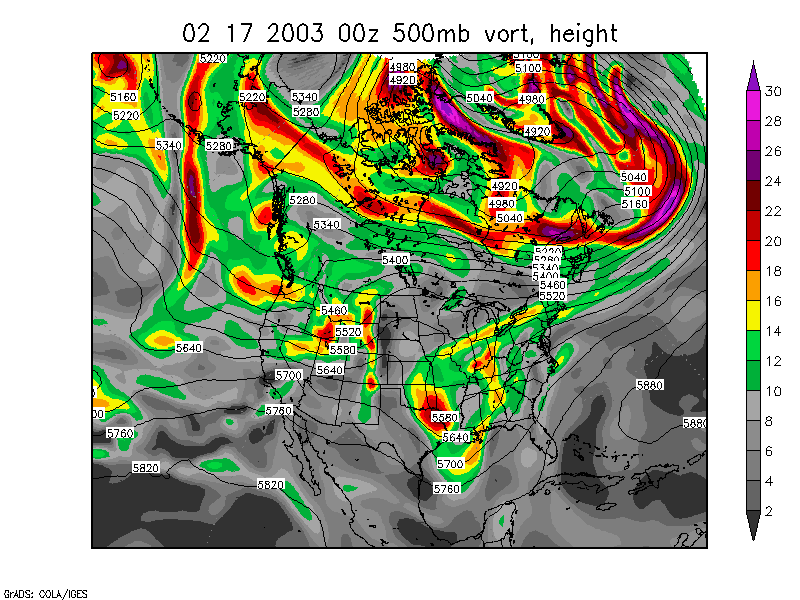
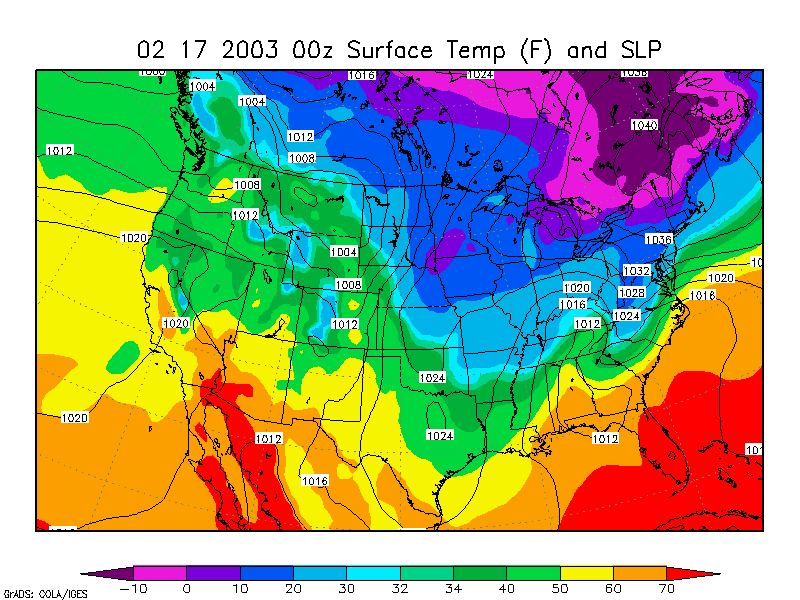
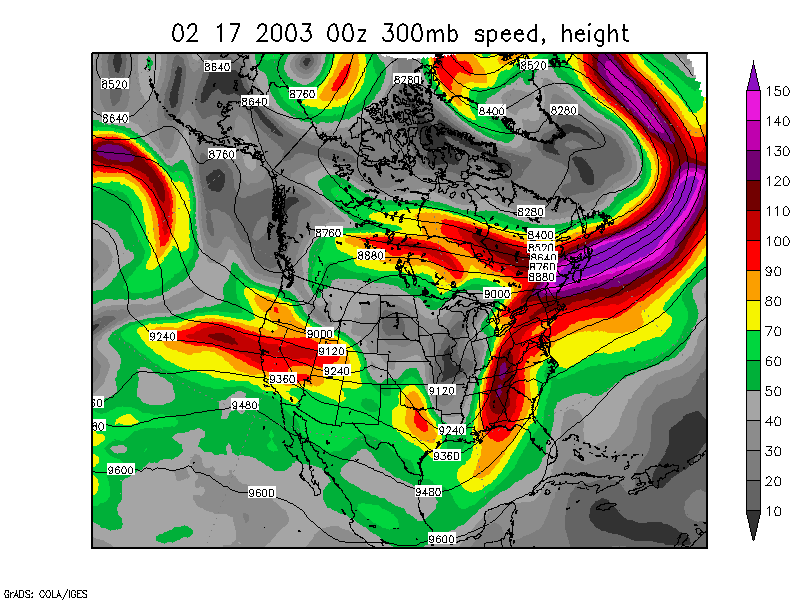
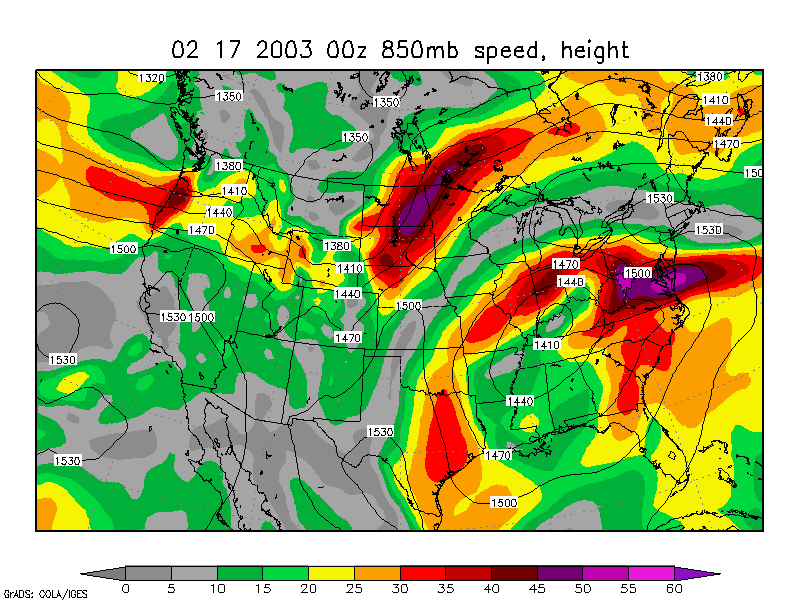
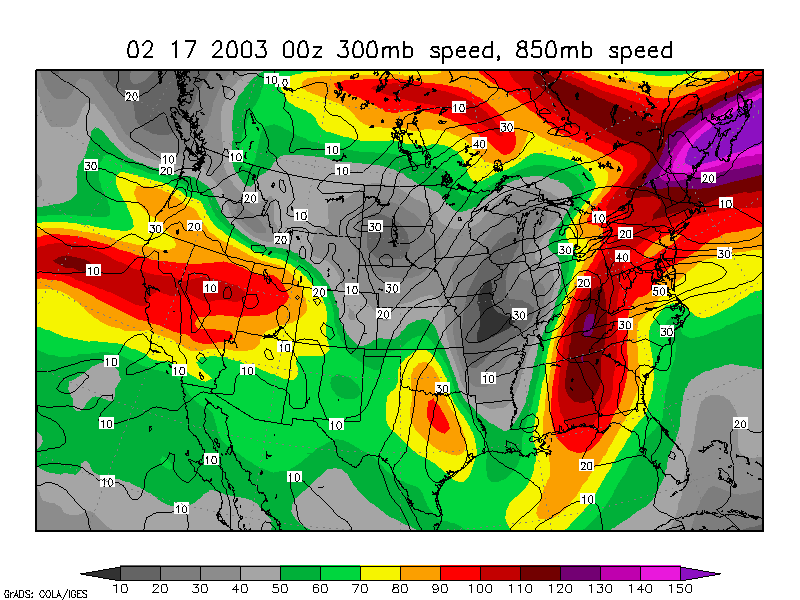
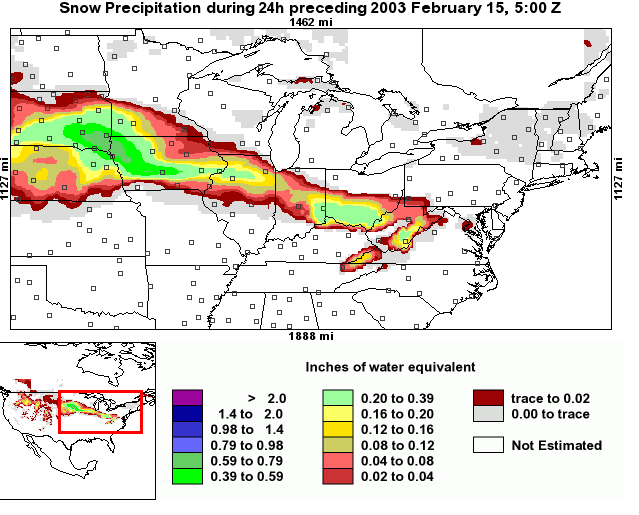
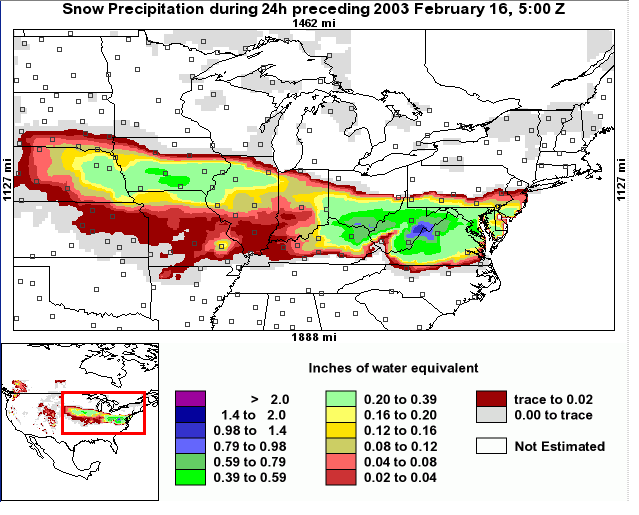
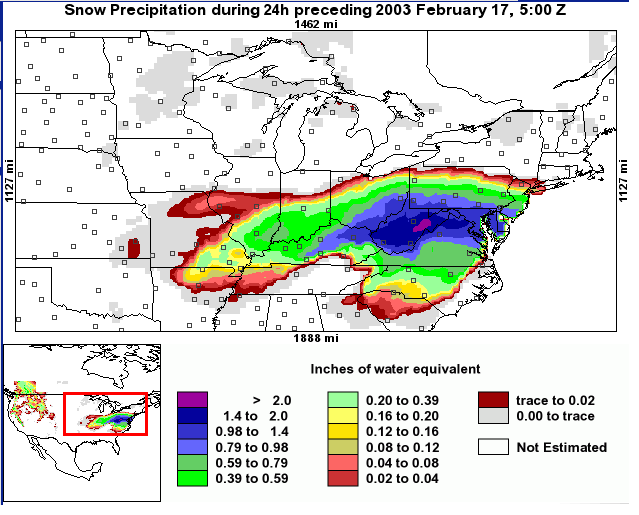
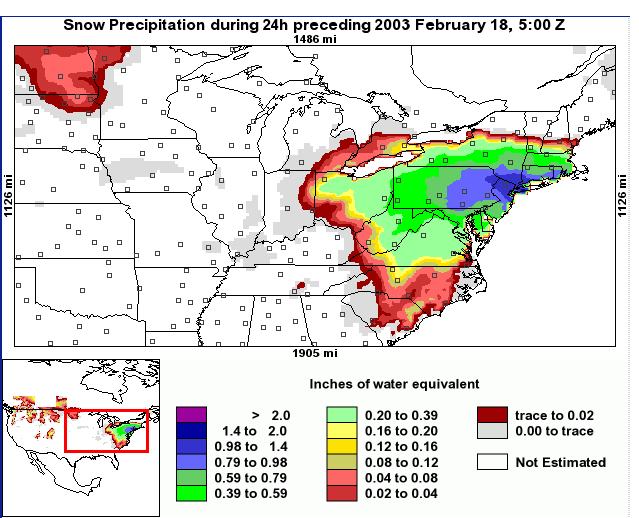
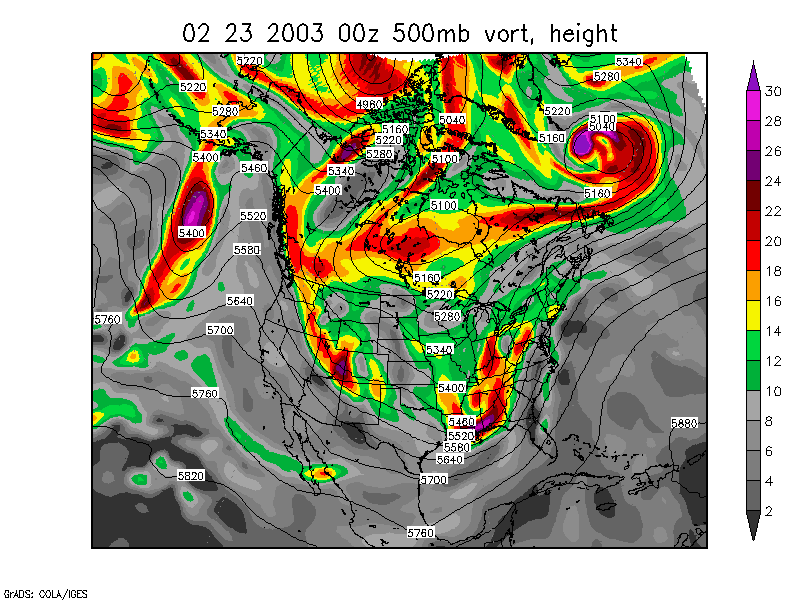
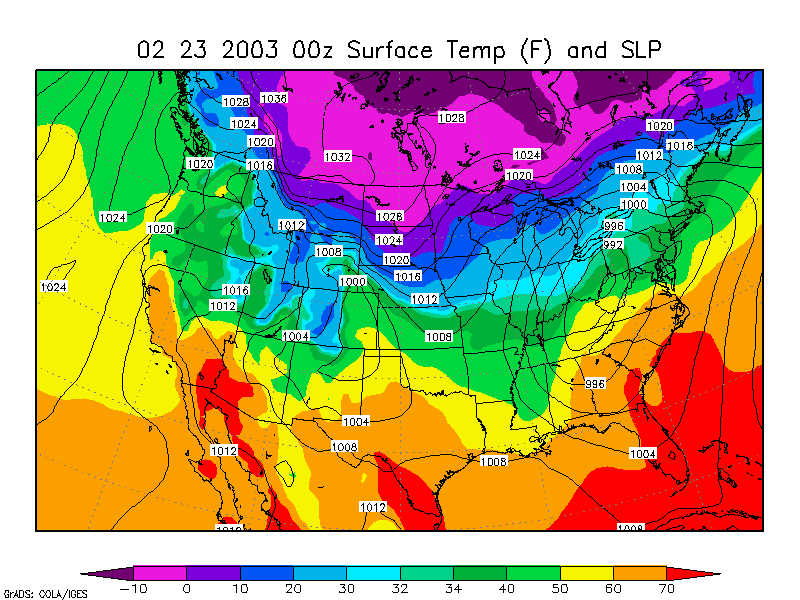
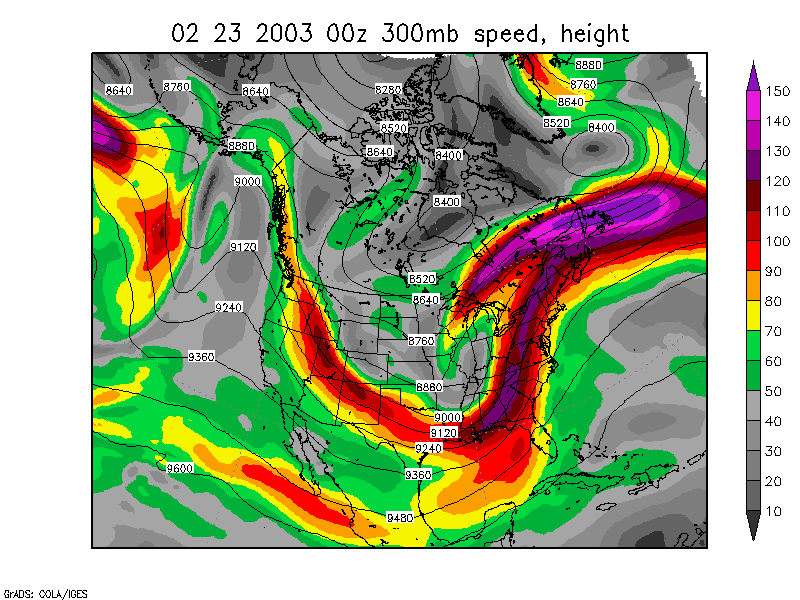
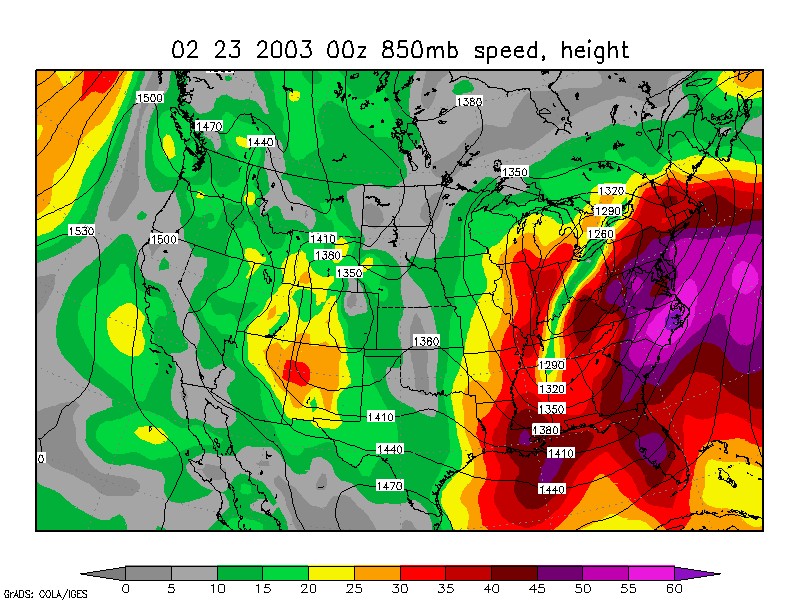
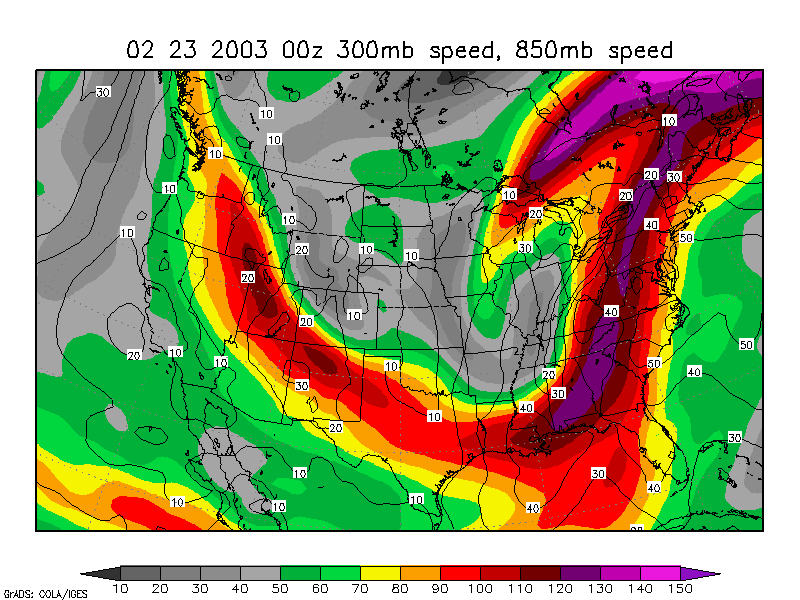
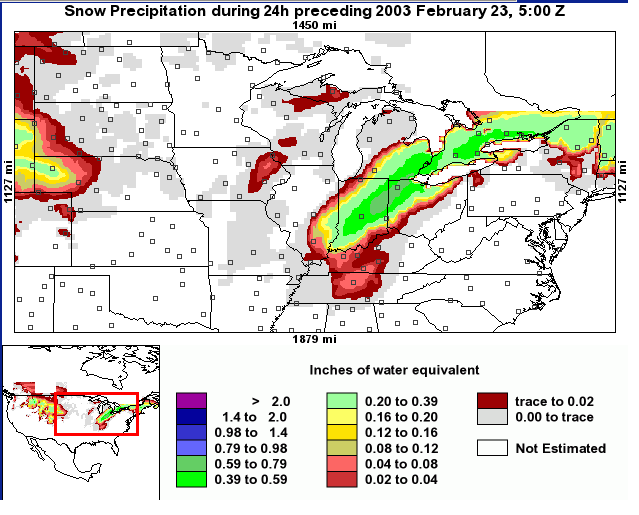
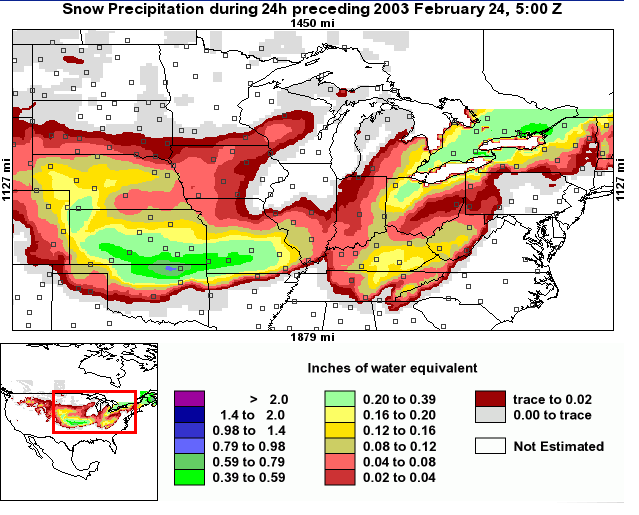
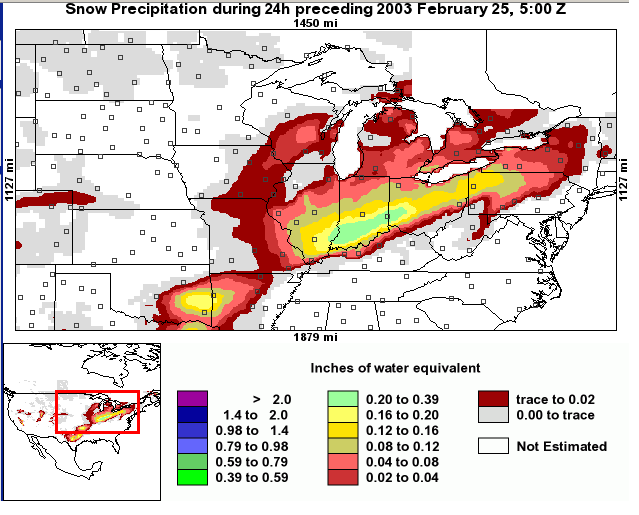
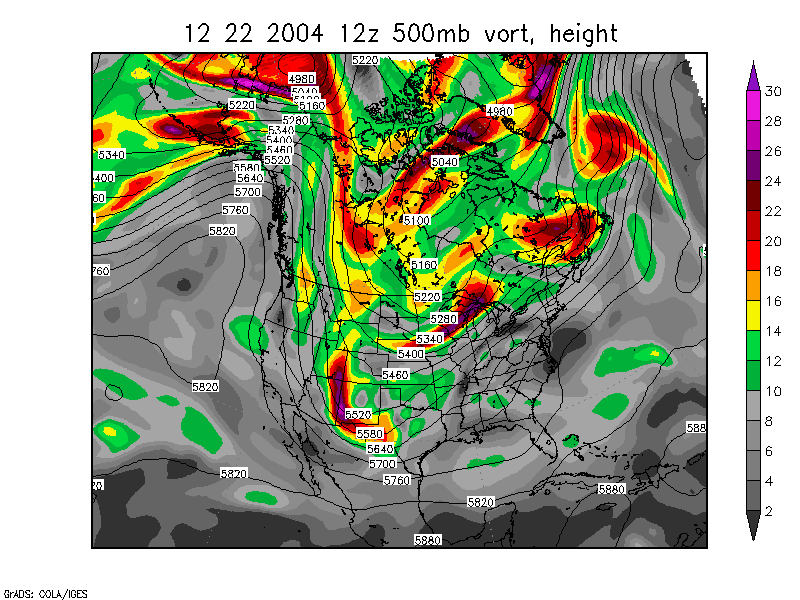
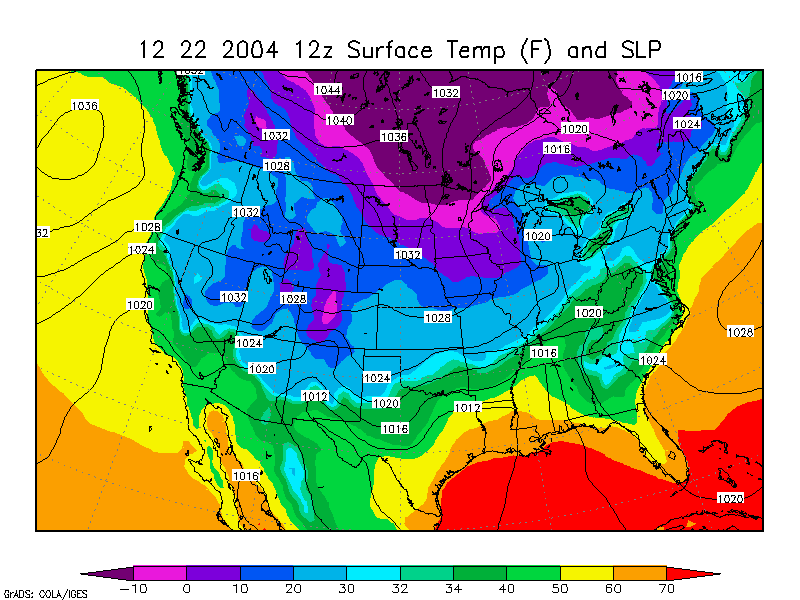
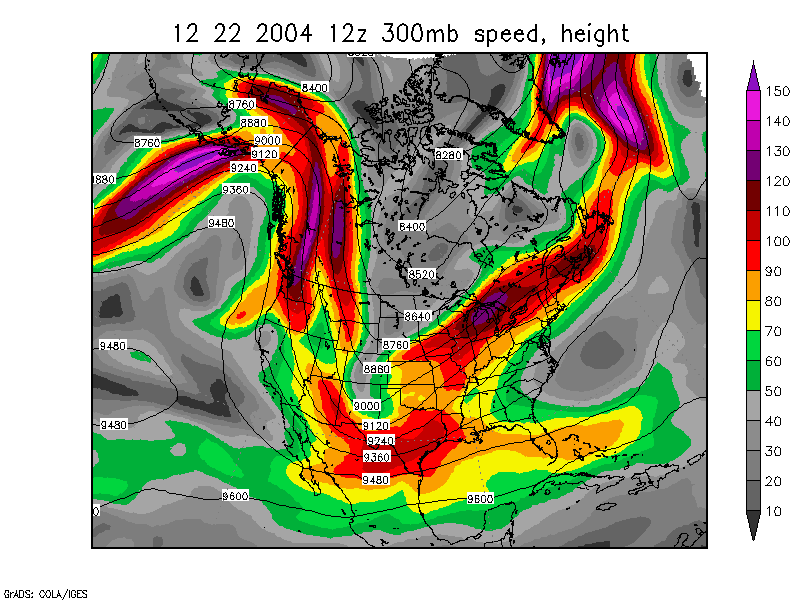
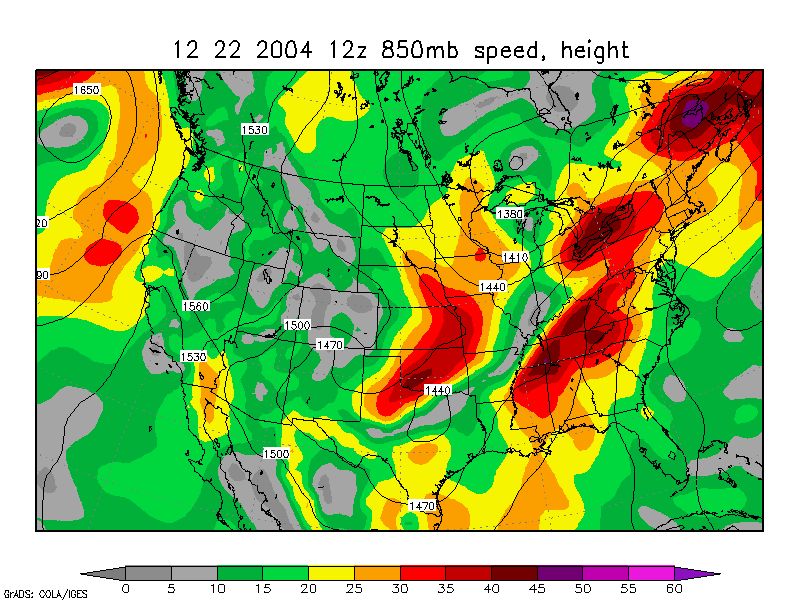
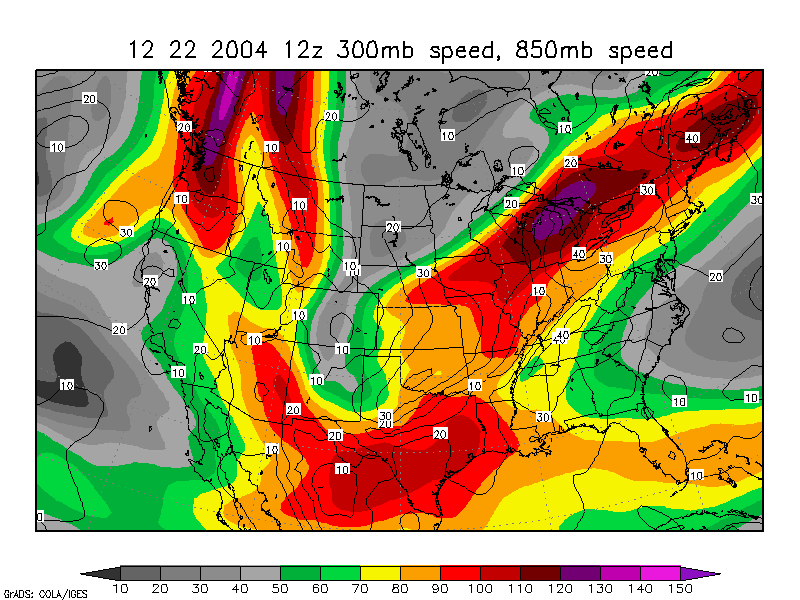
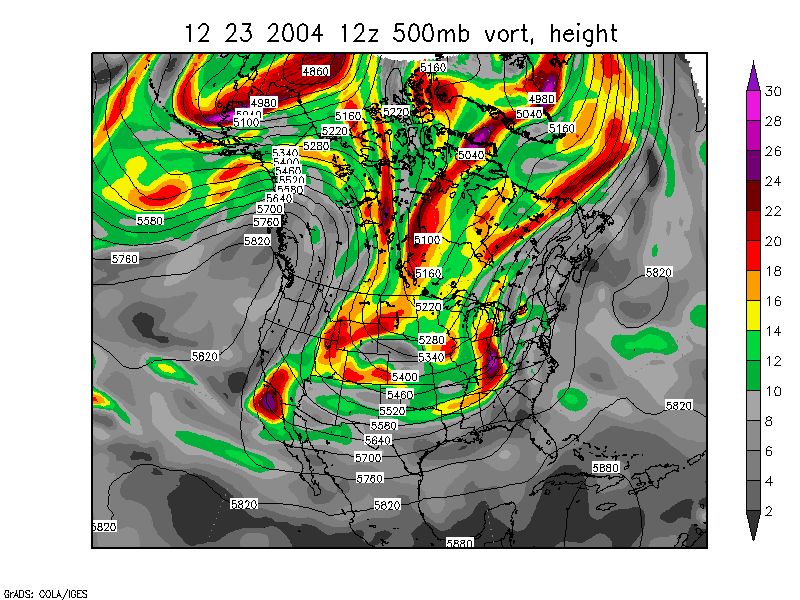
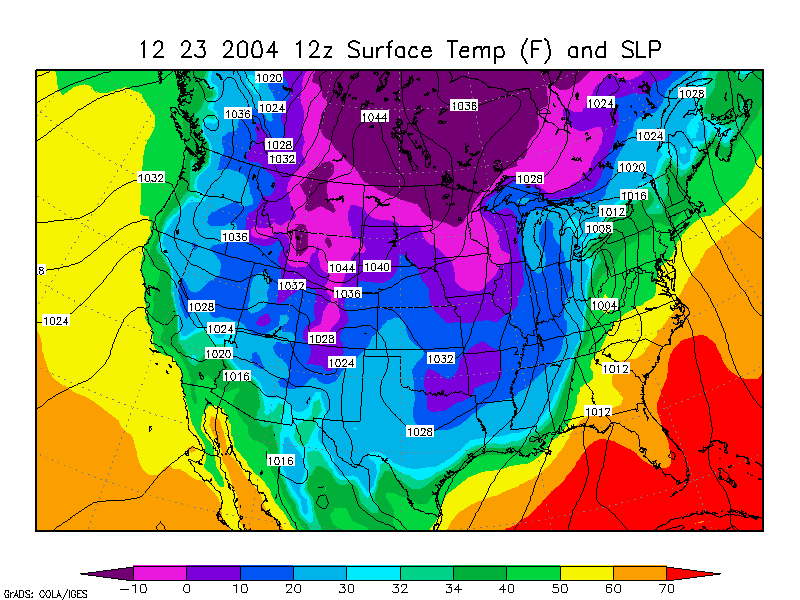
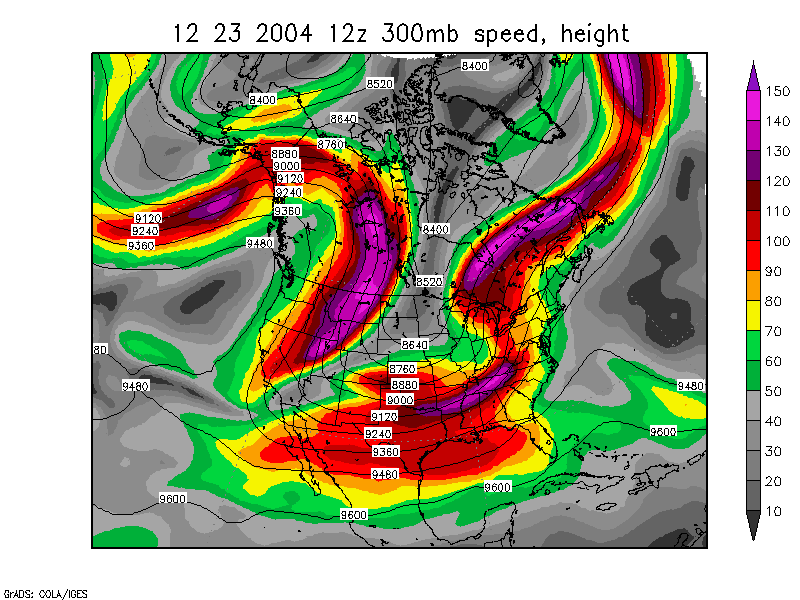
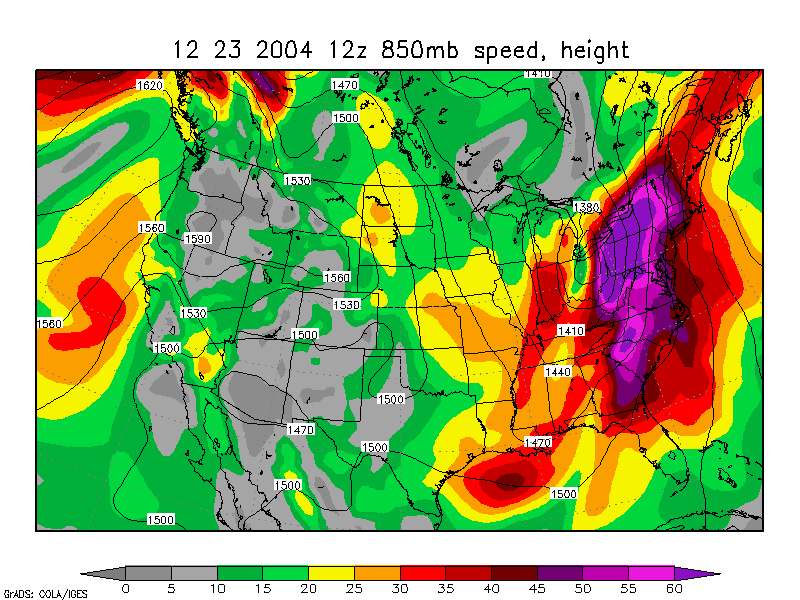
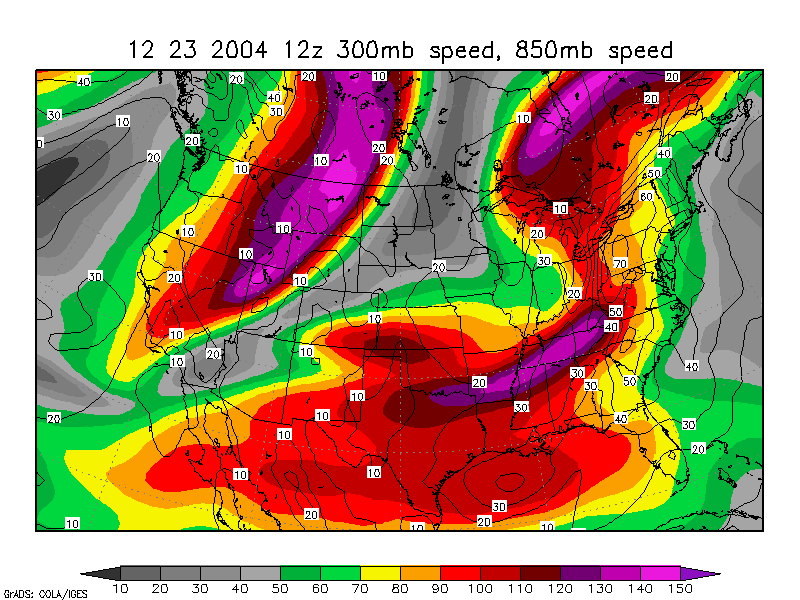
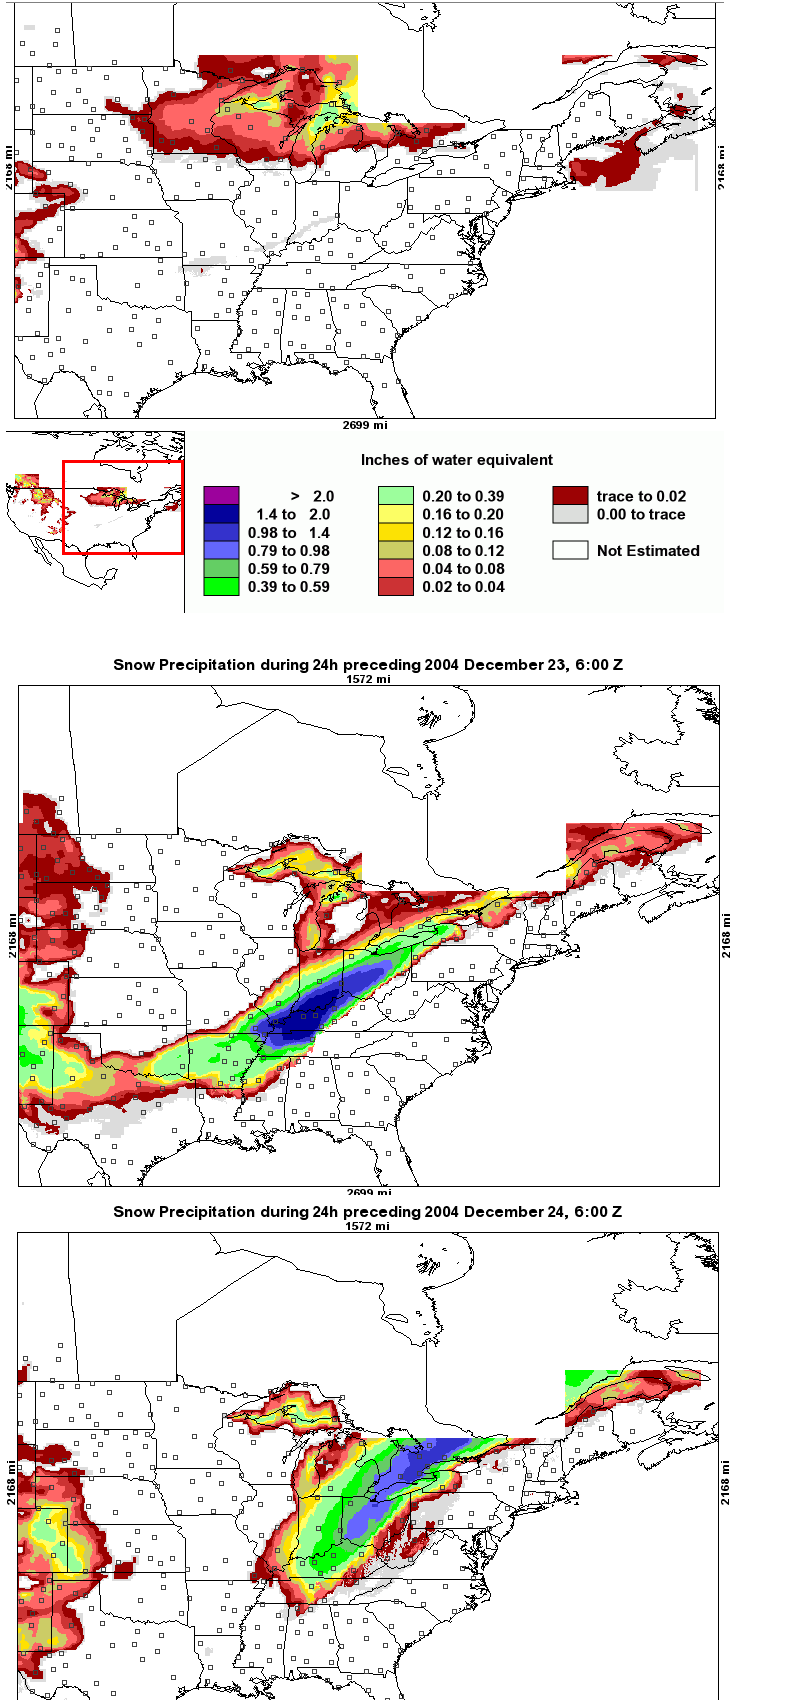
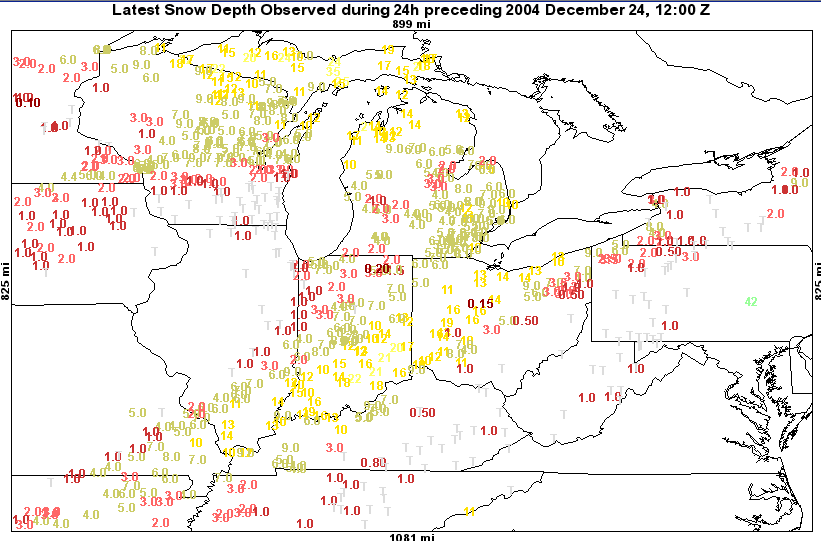
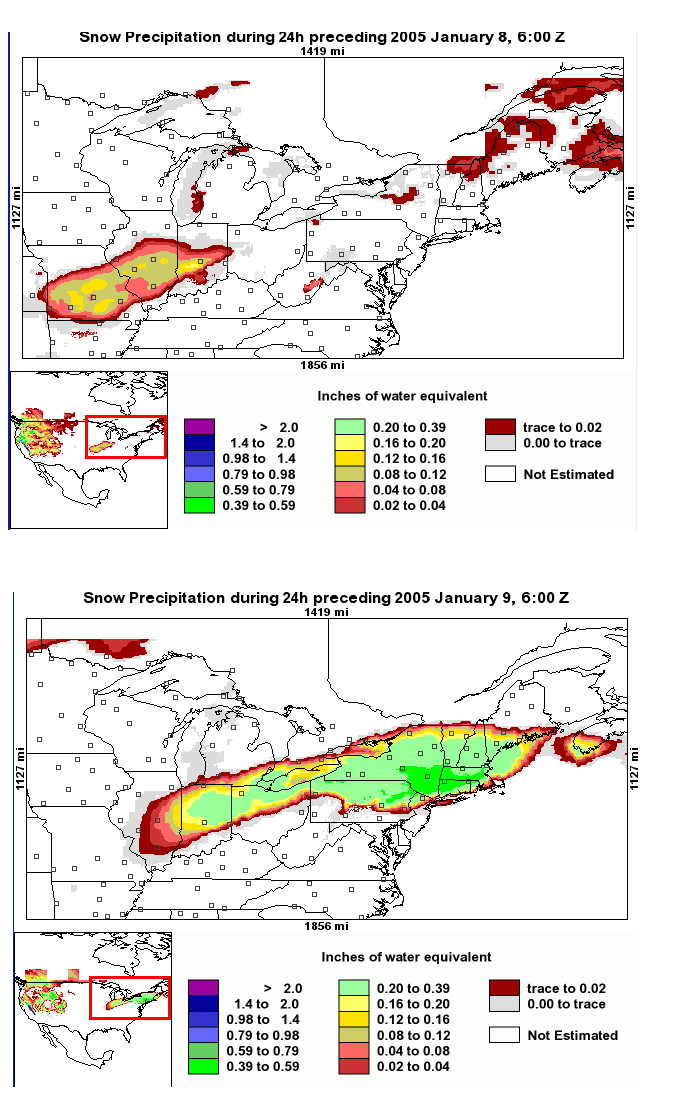
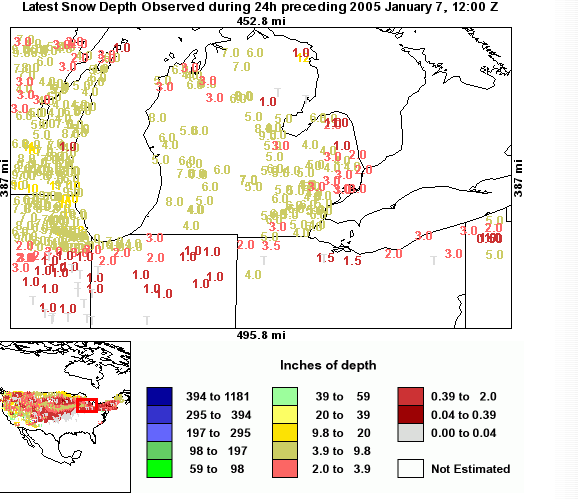
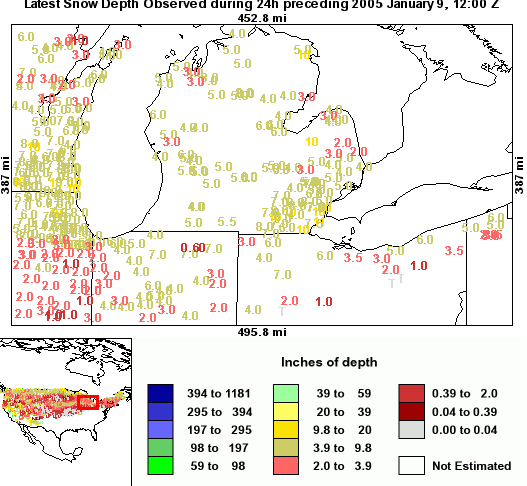
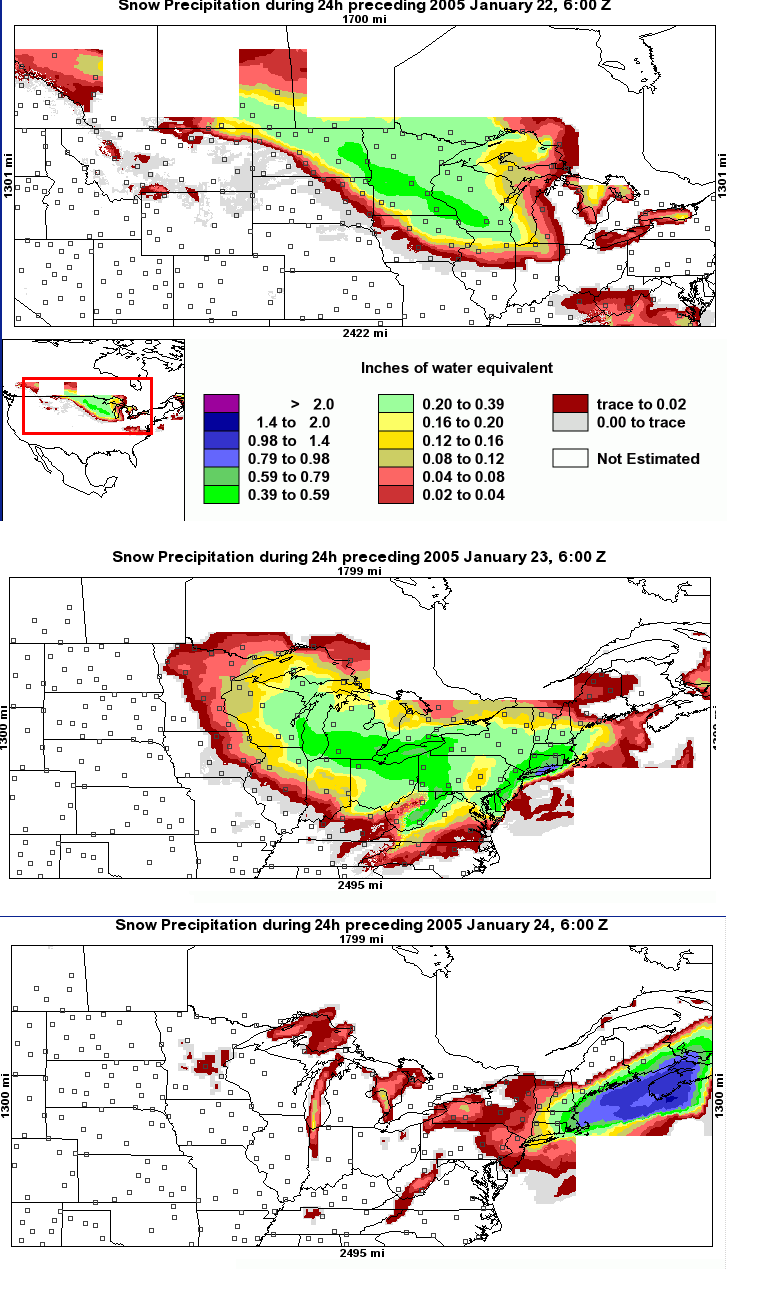
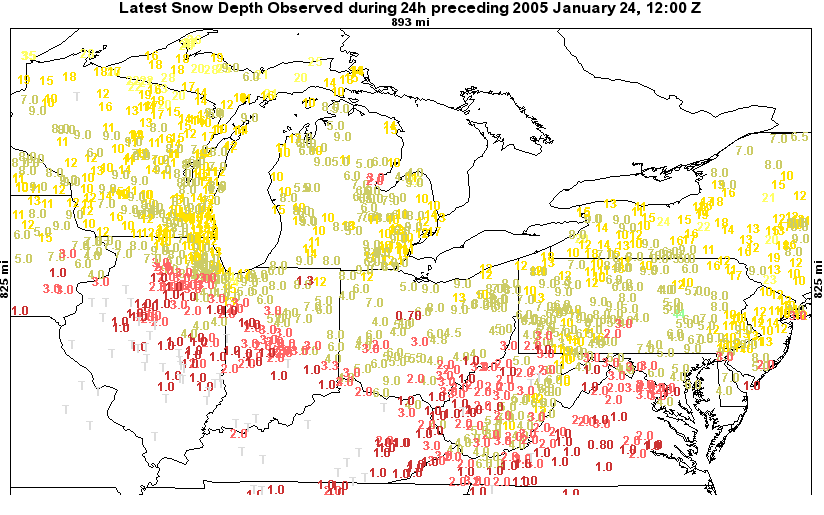
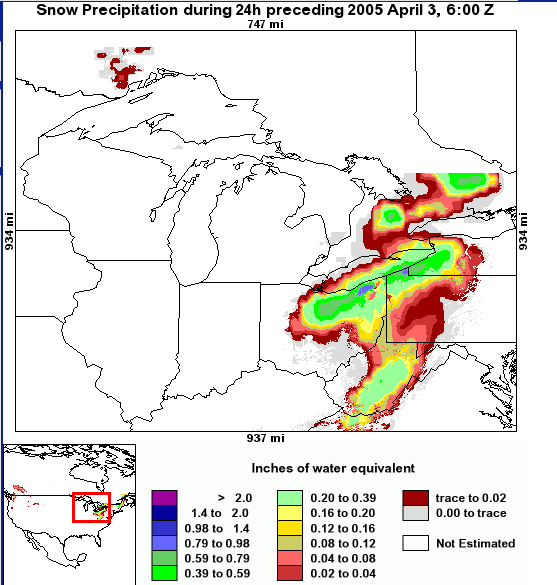
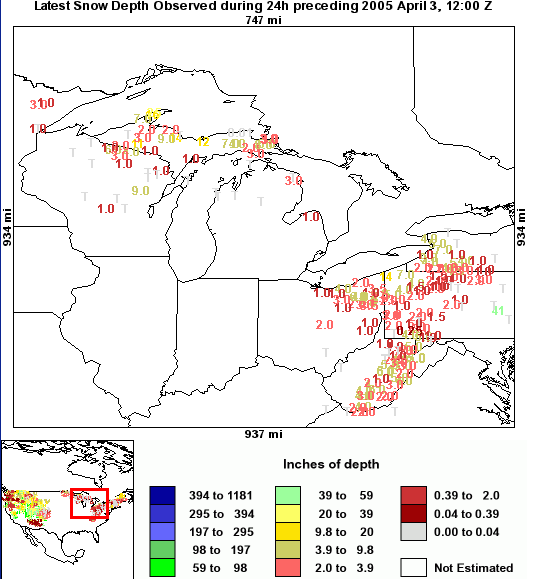
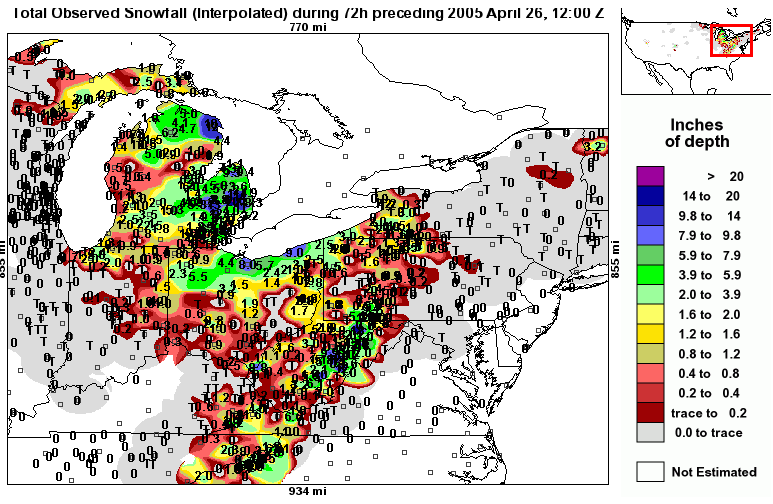
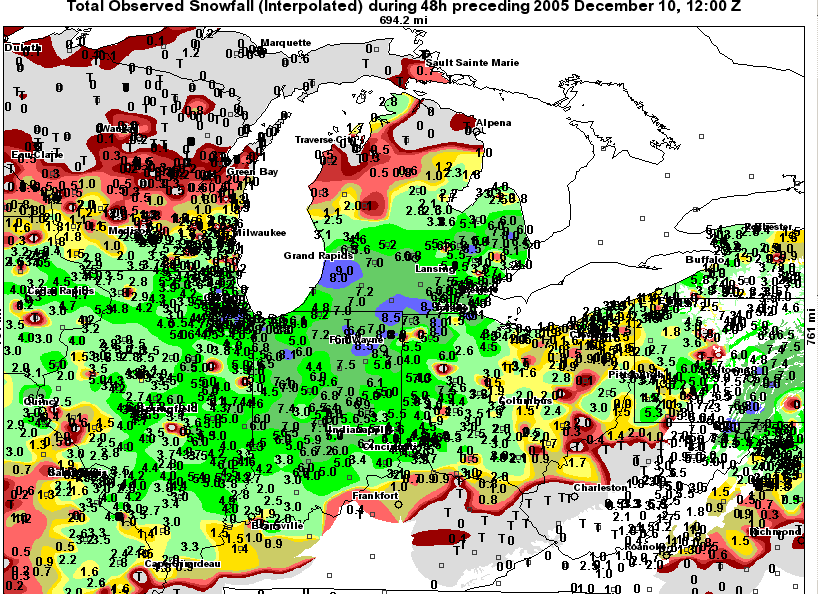
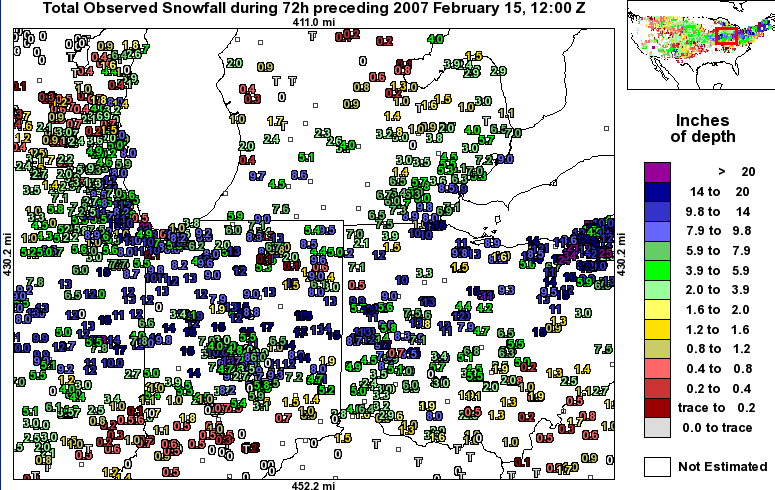
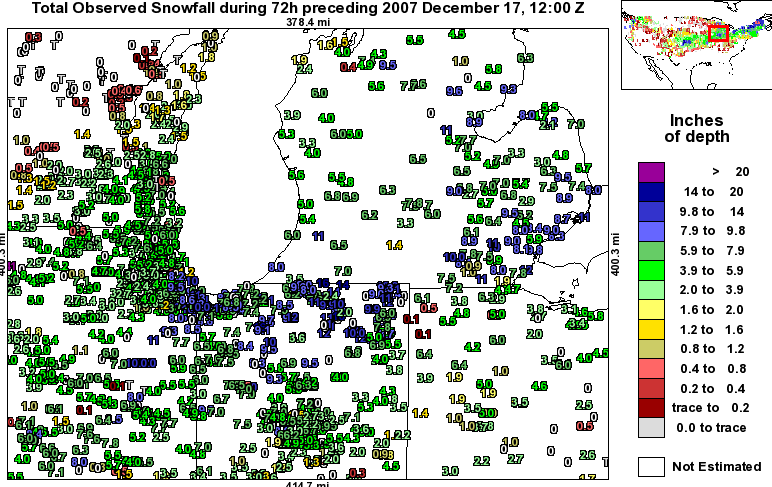
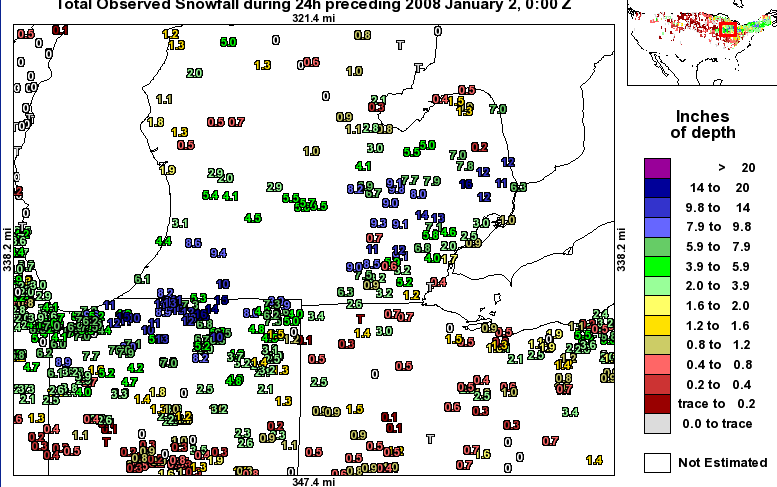