
Ann Arbor, Michigan, June 30, 2000
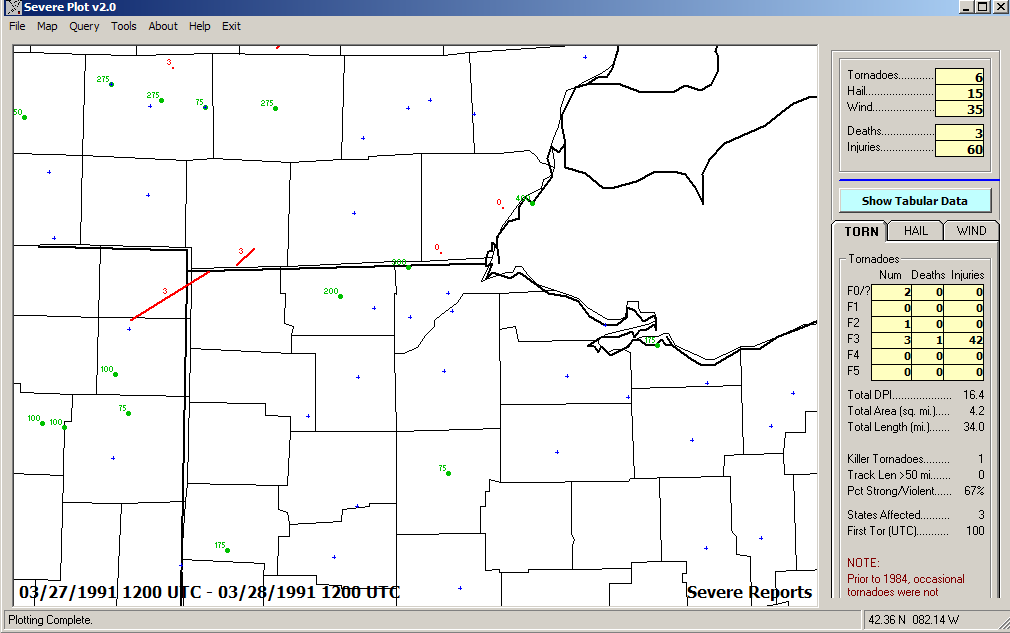
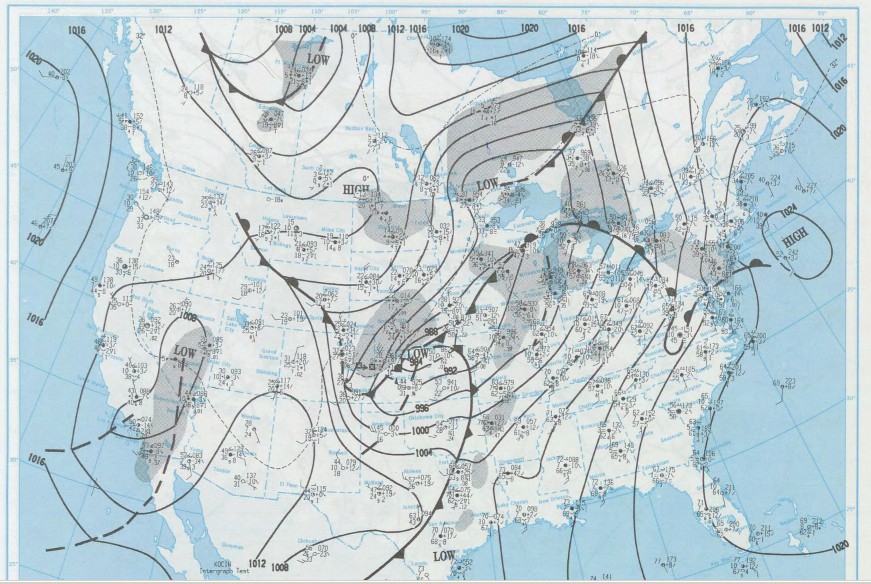
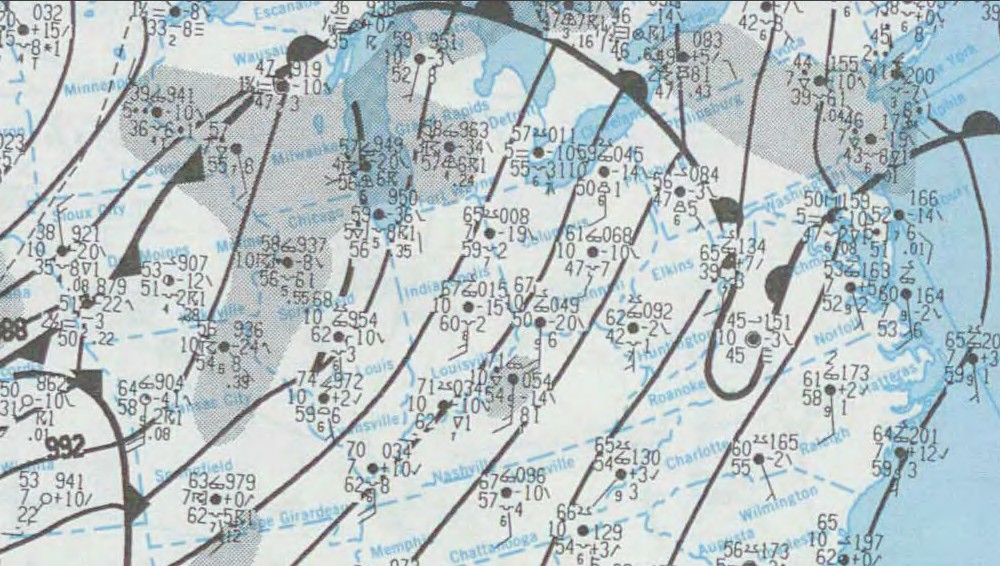
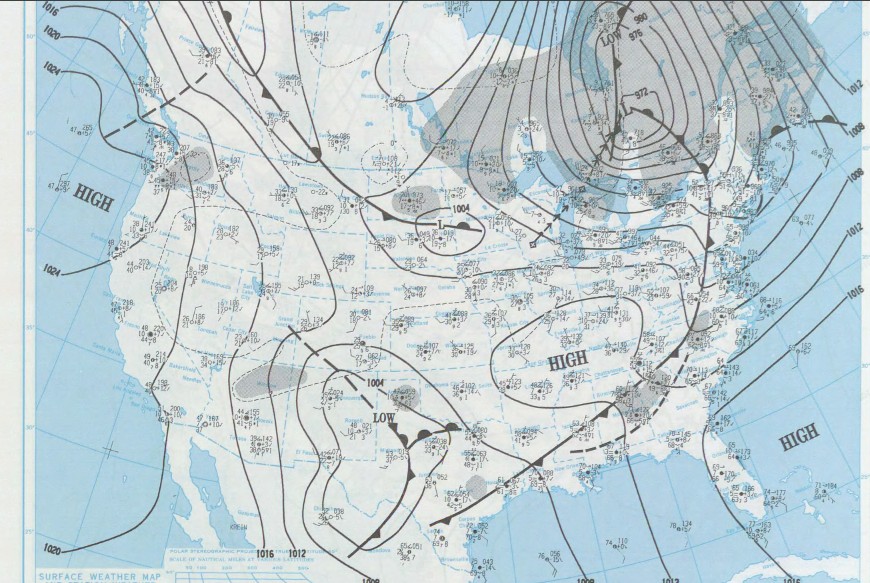
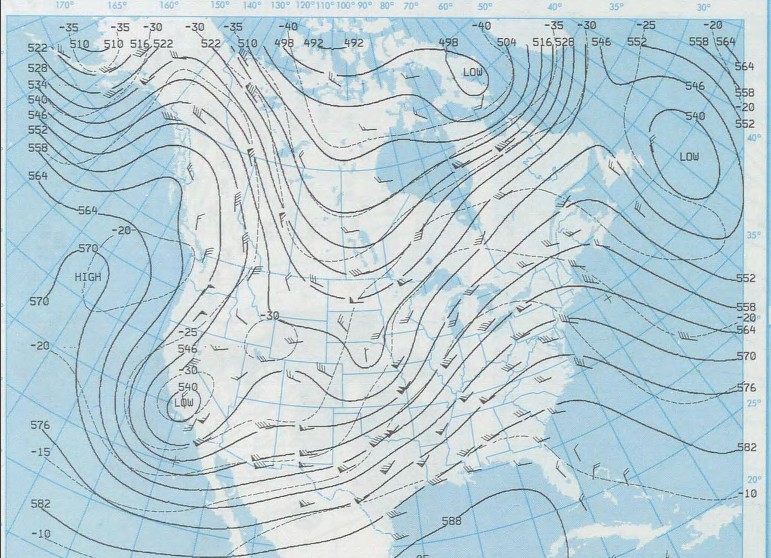
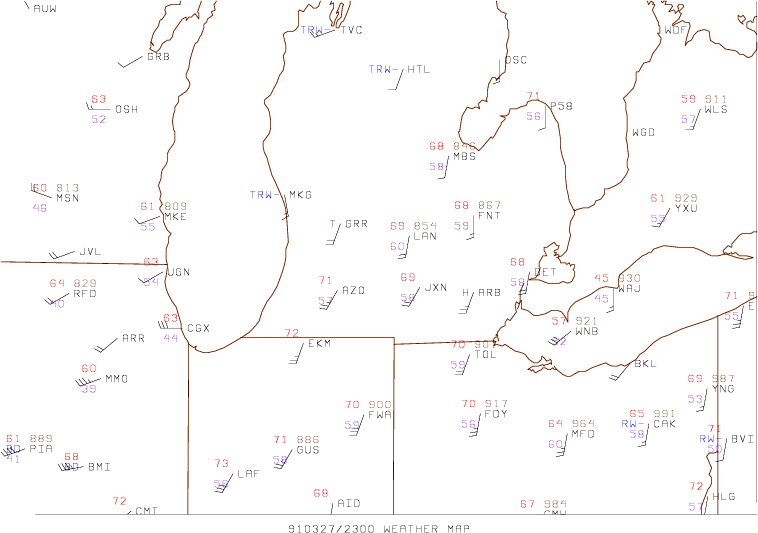
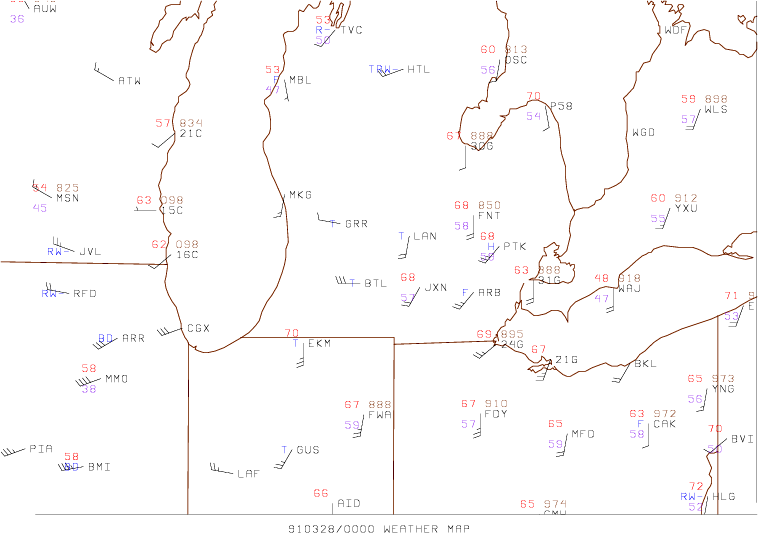
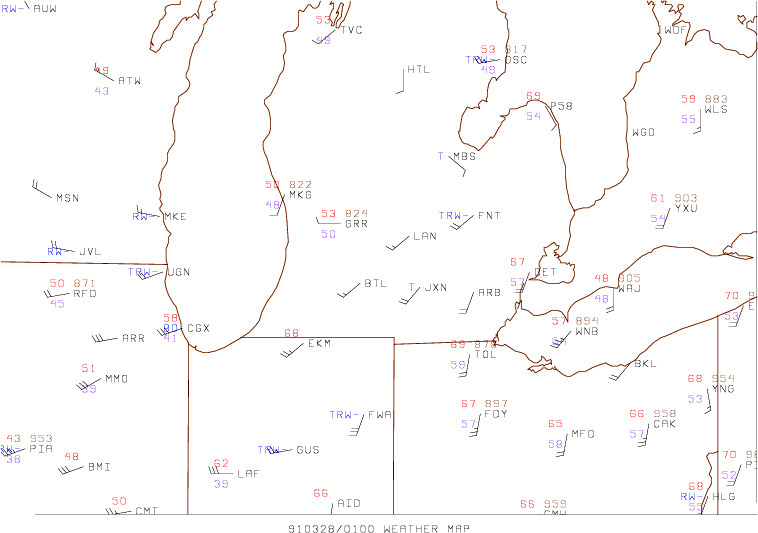
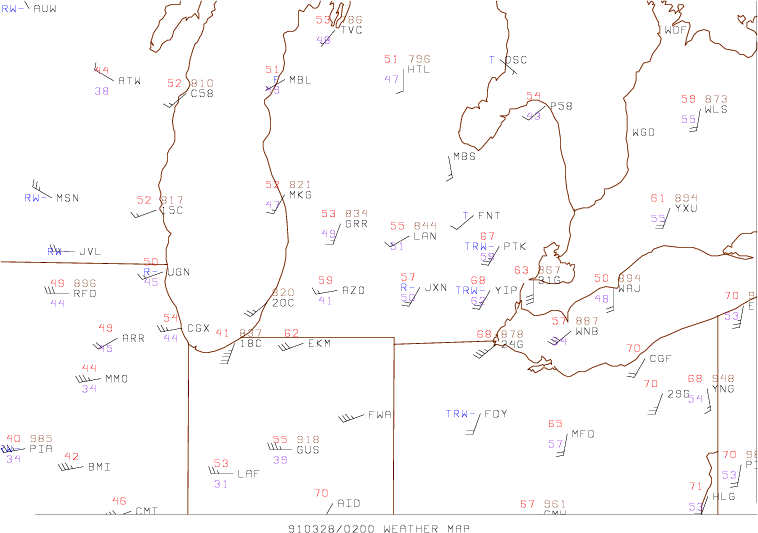
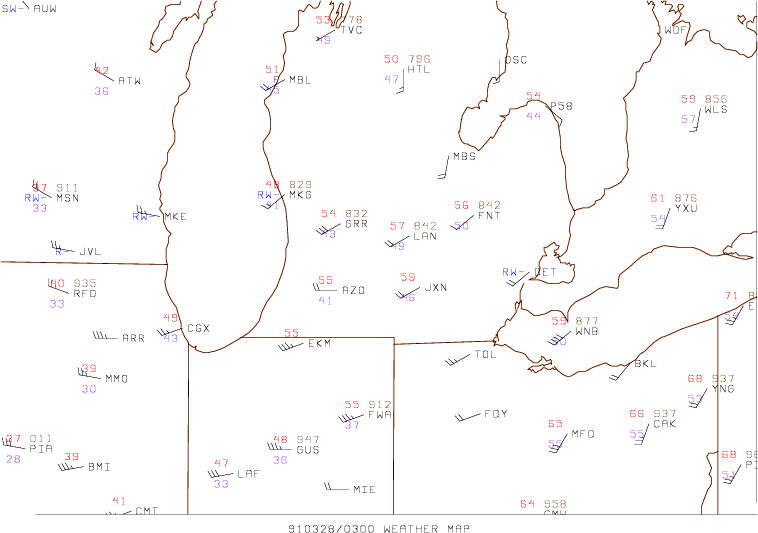
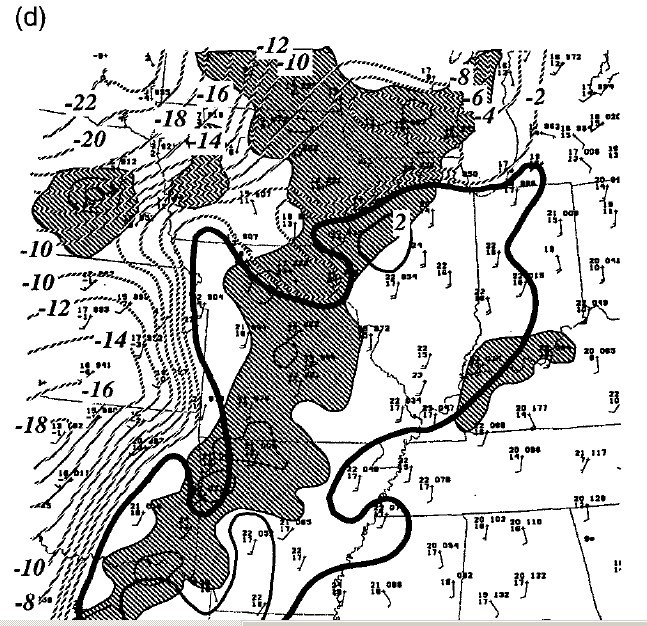
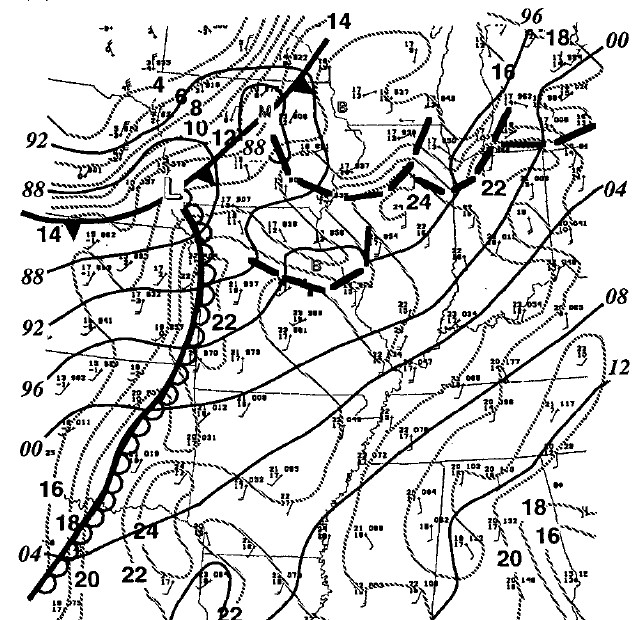
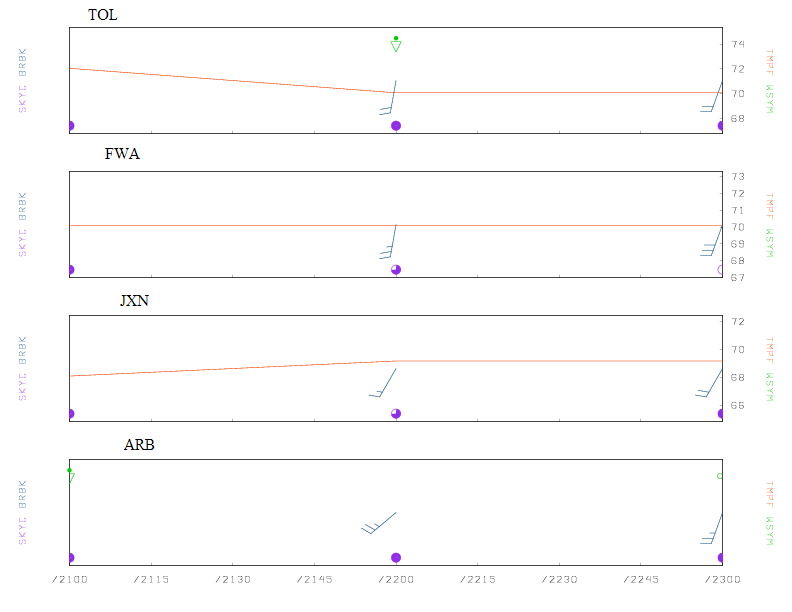
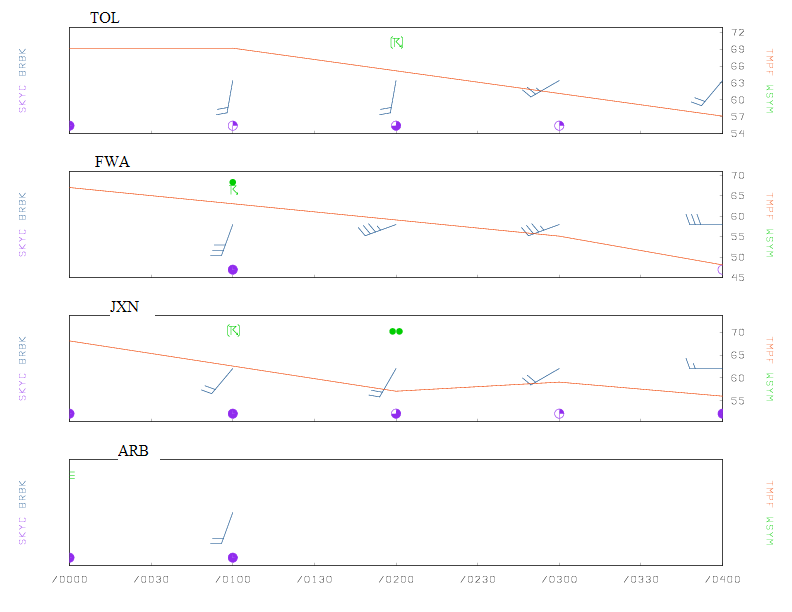
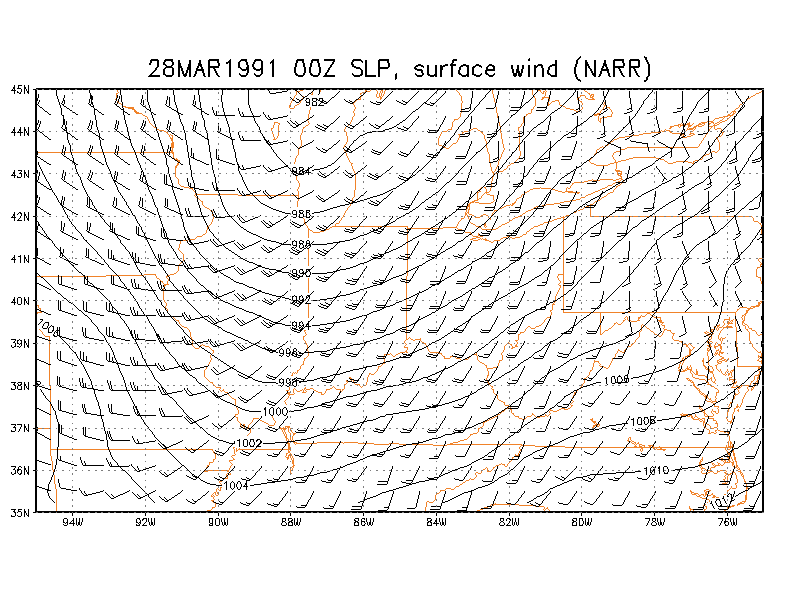
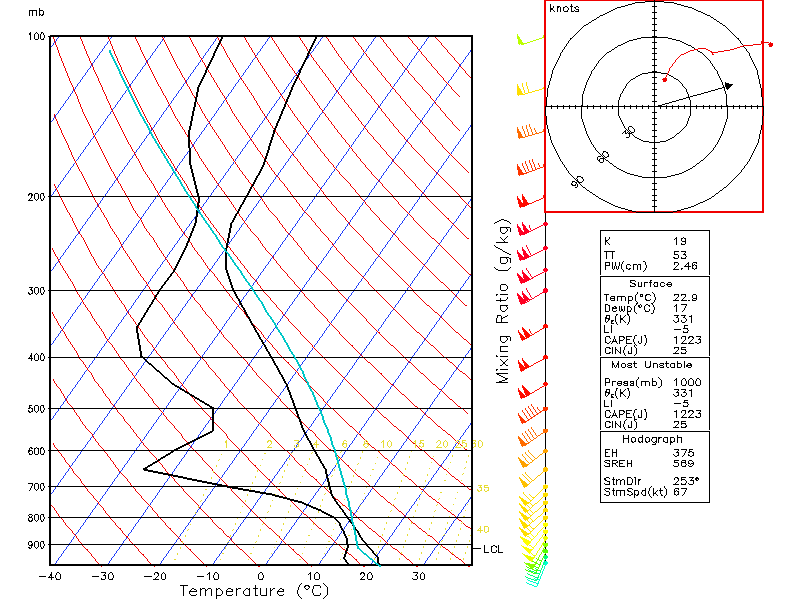
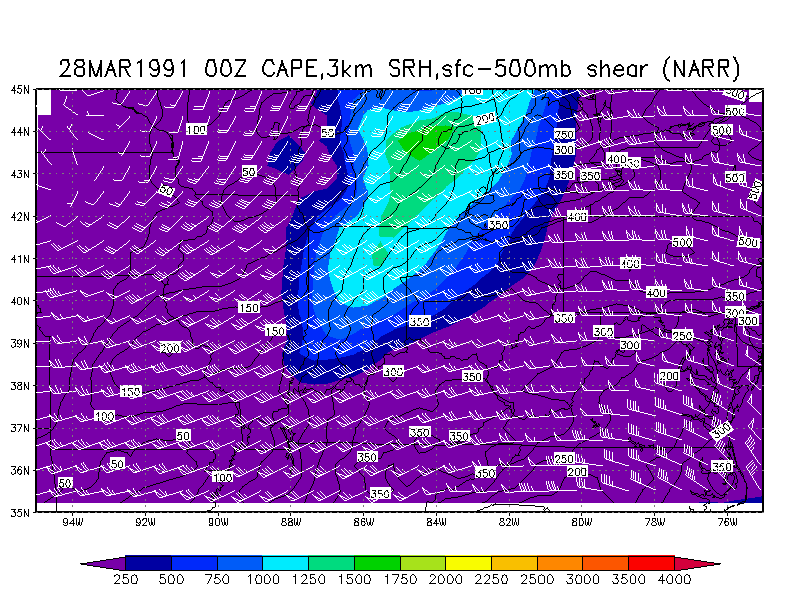
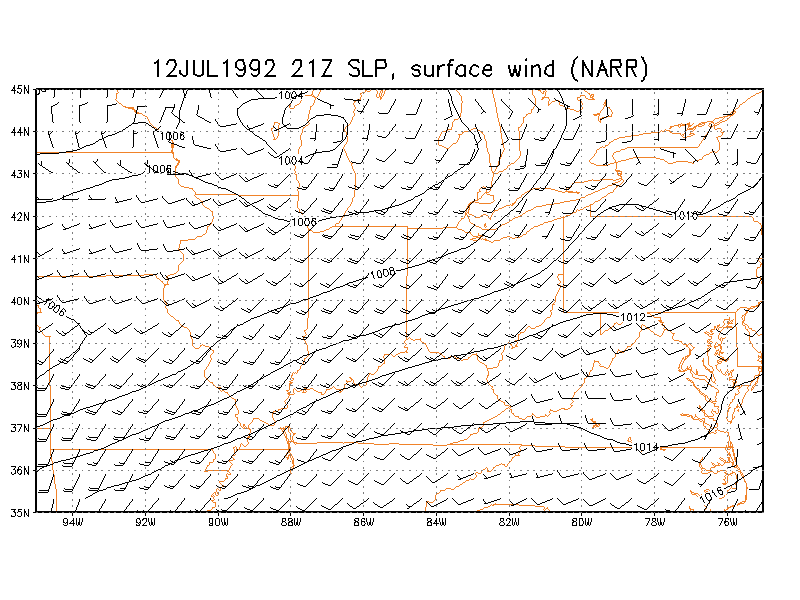
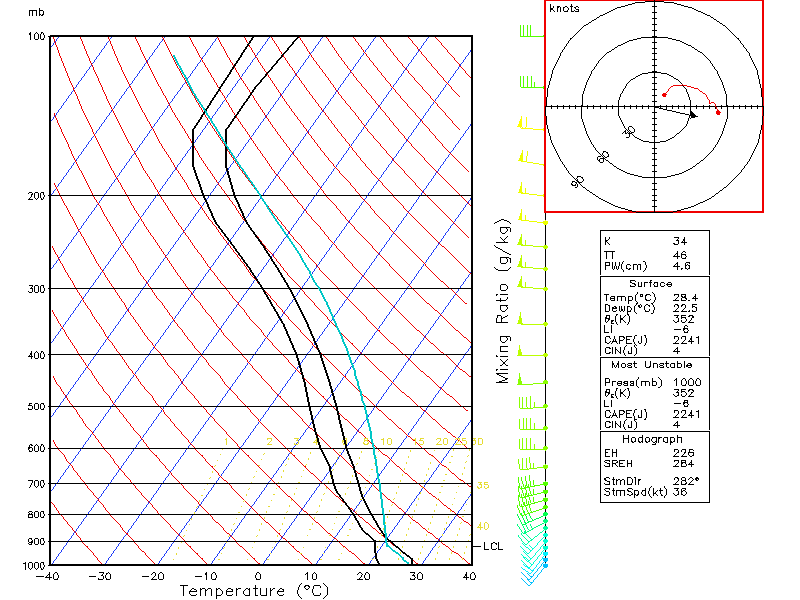
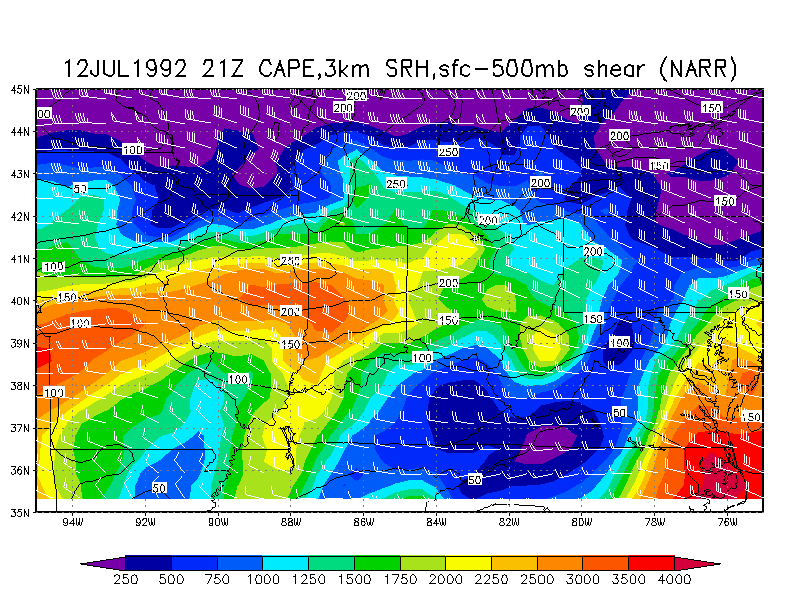
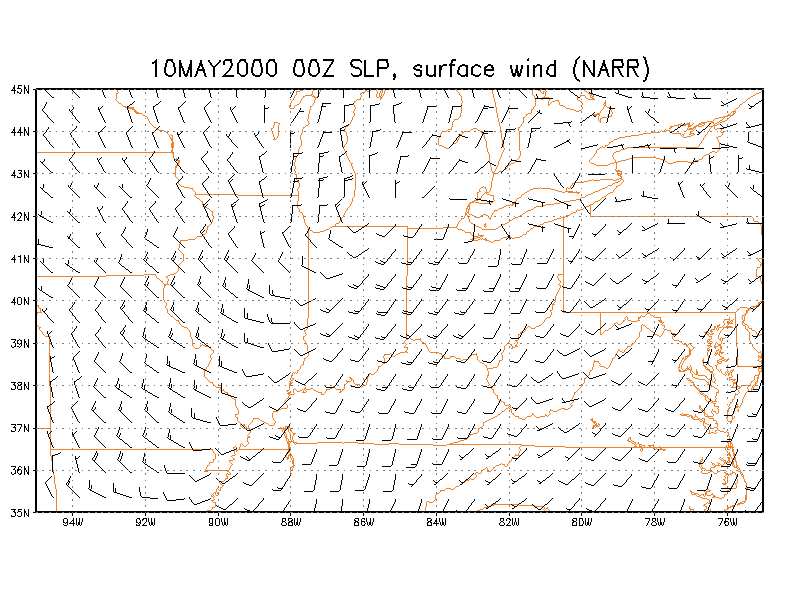
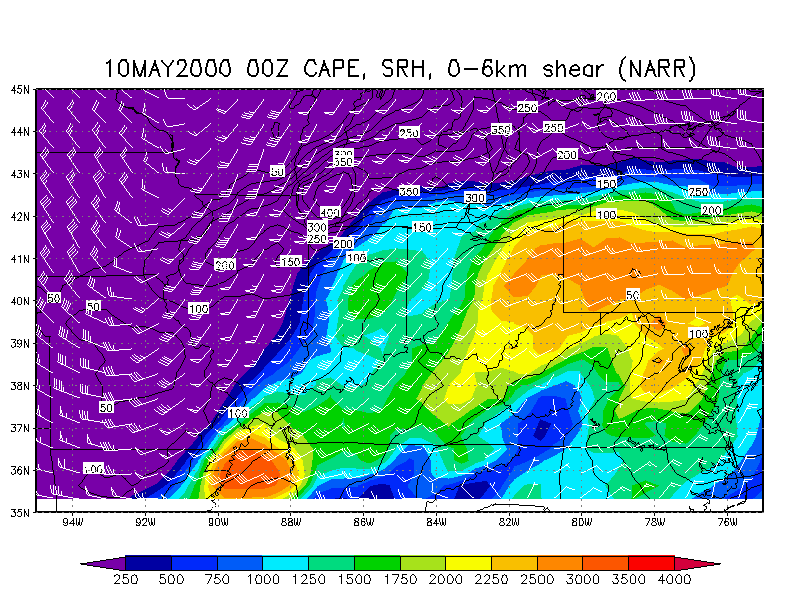
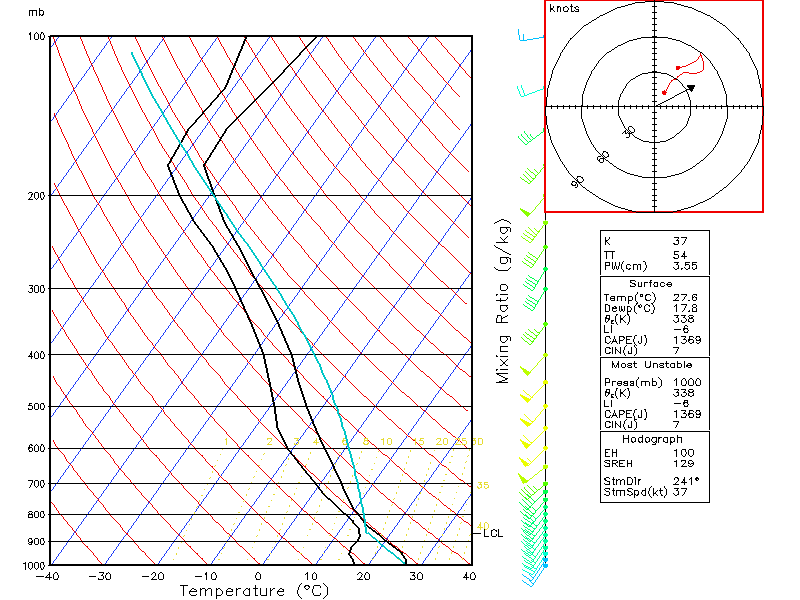
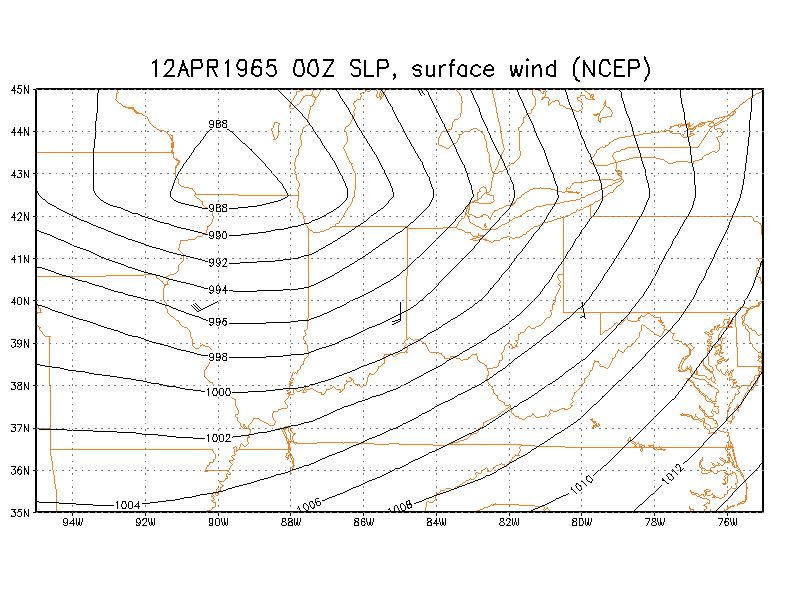
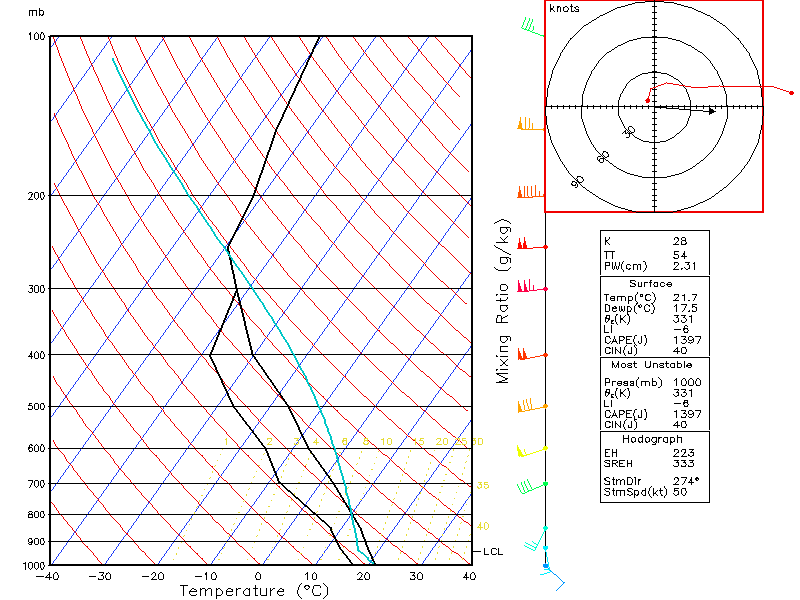
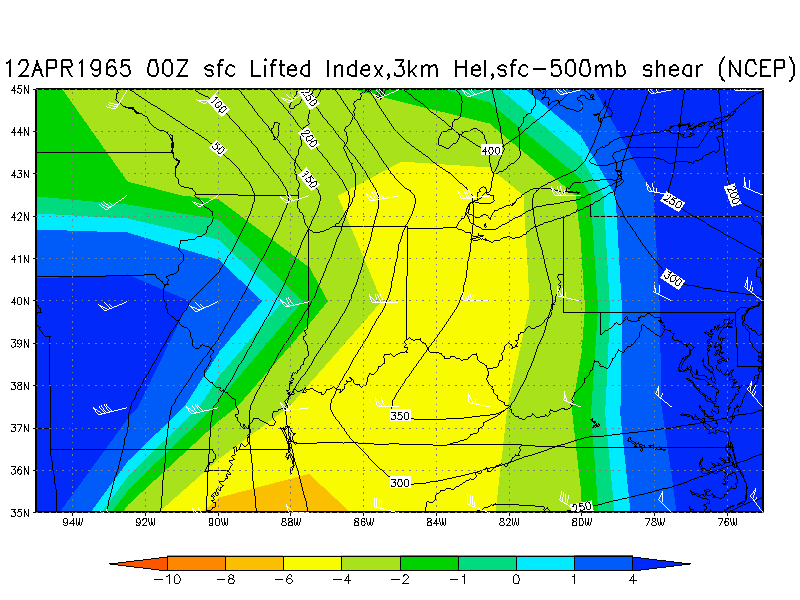
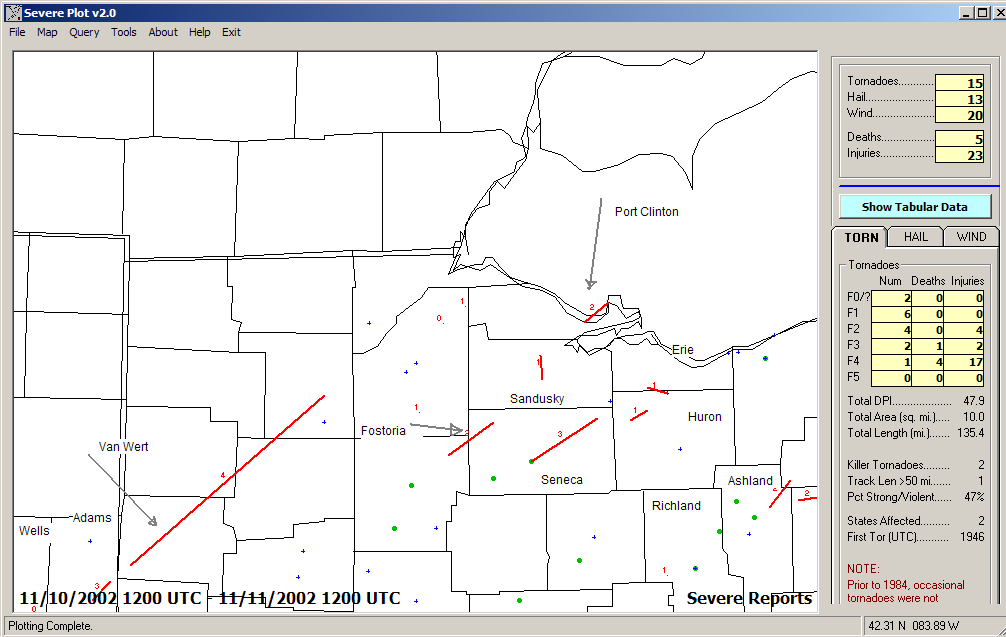
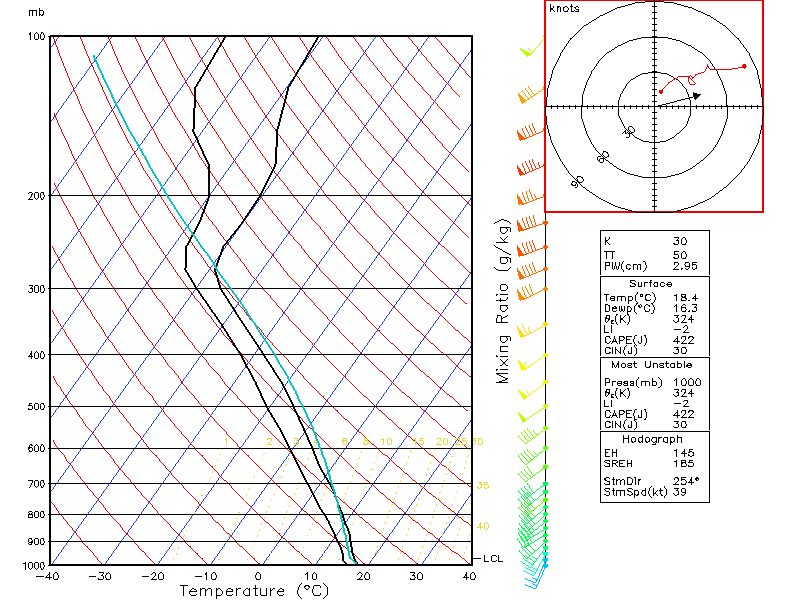
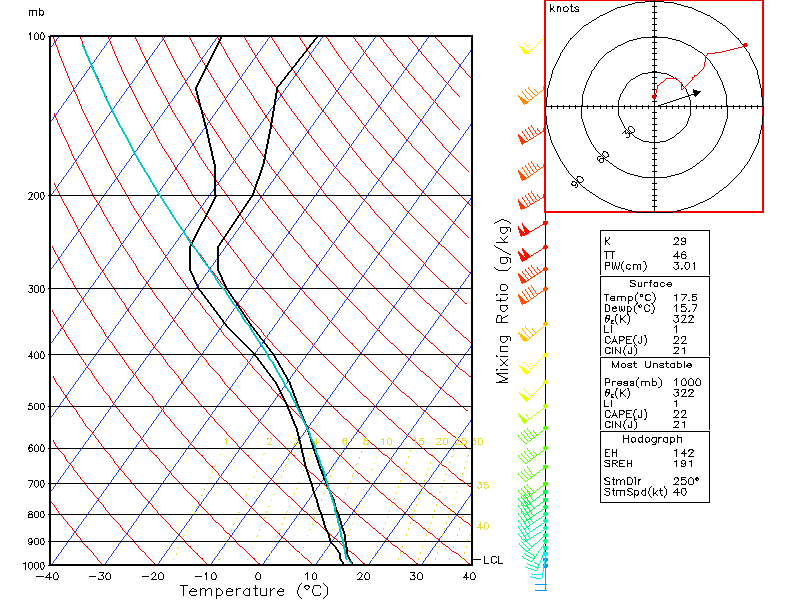
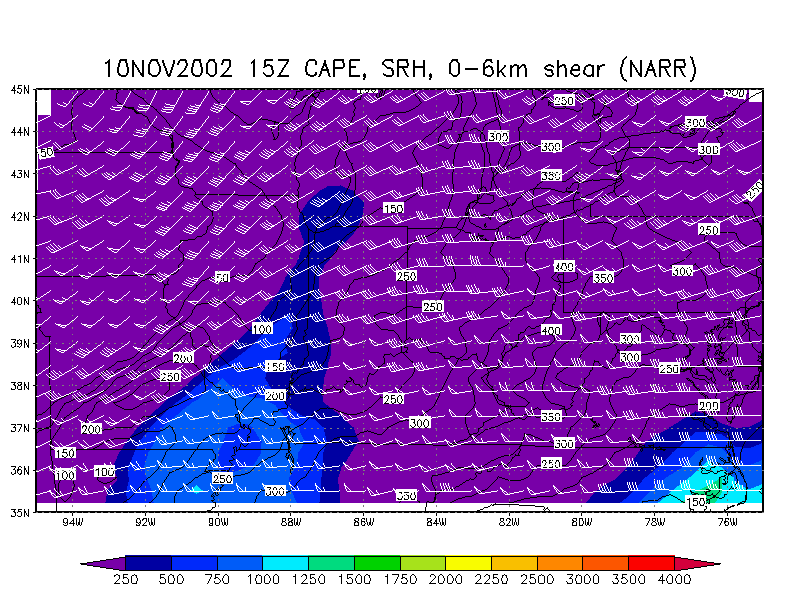
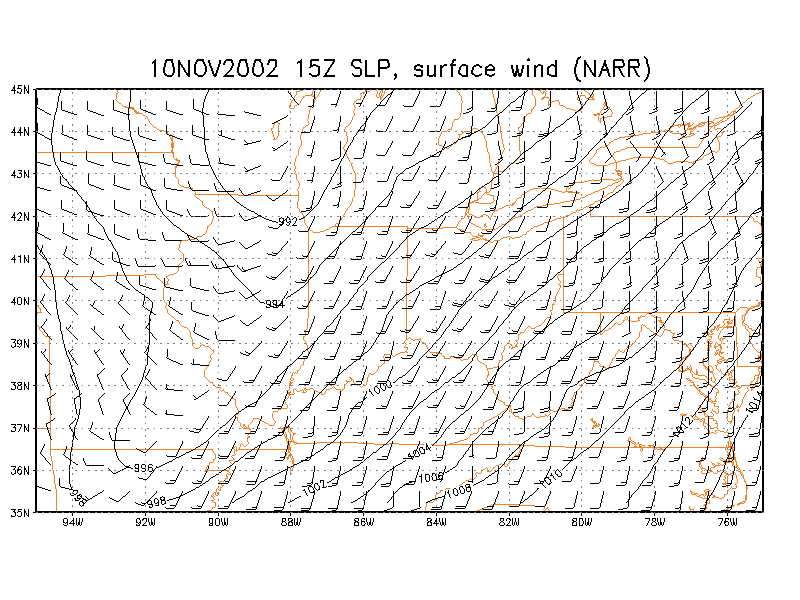
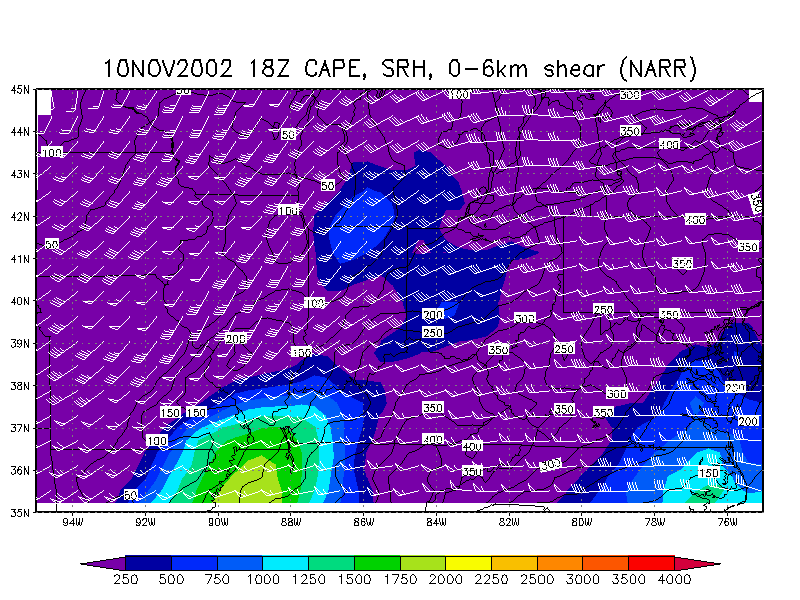
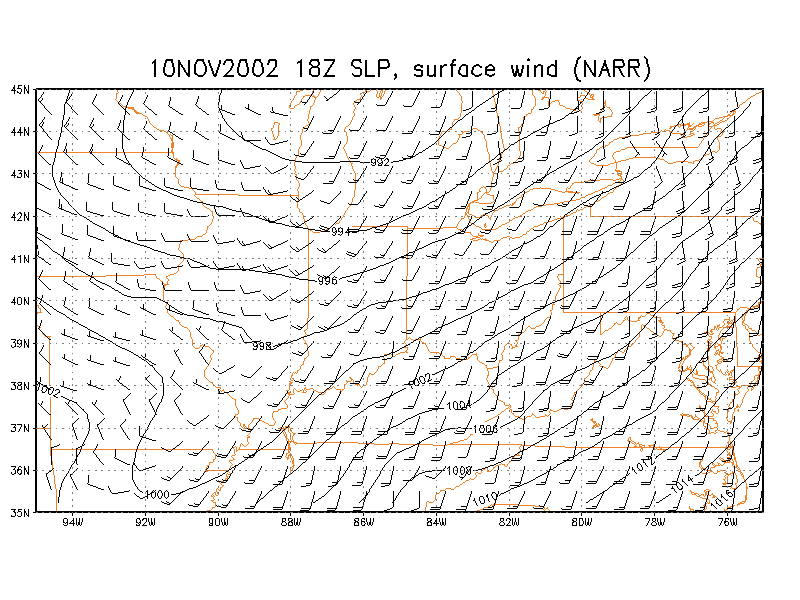
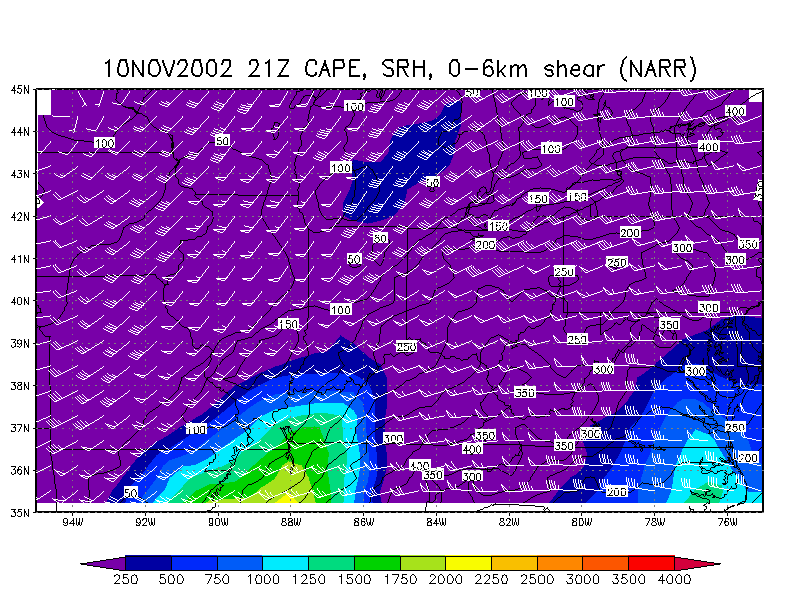
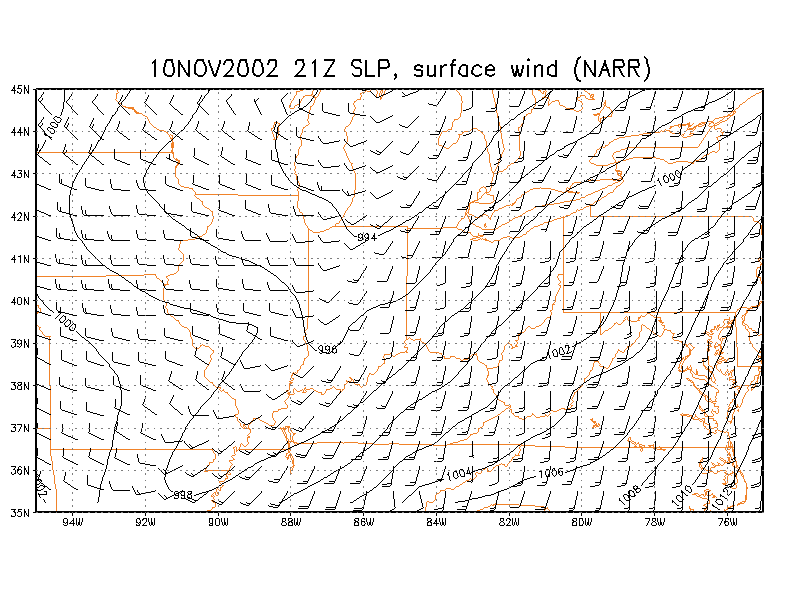
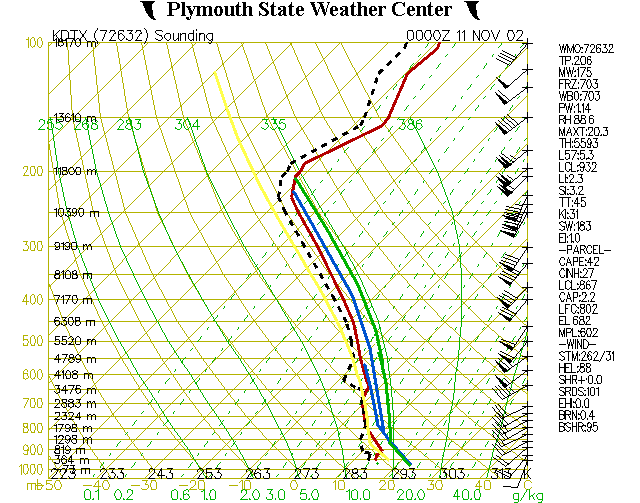
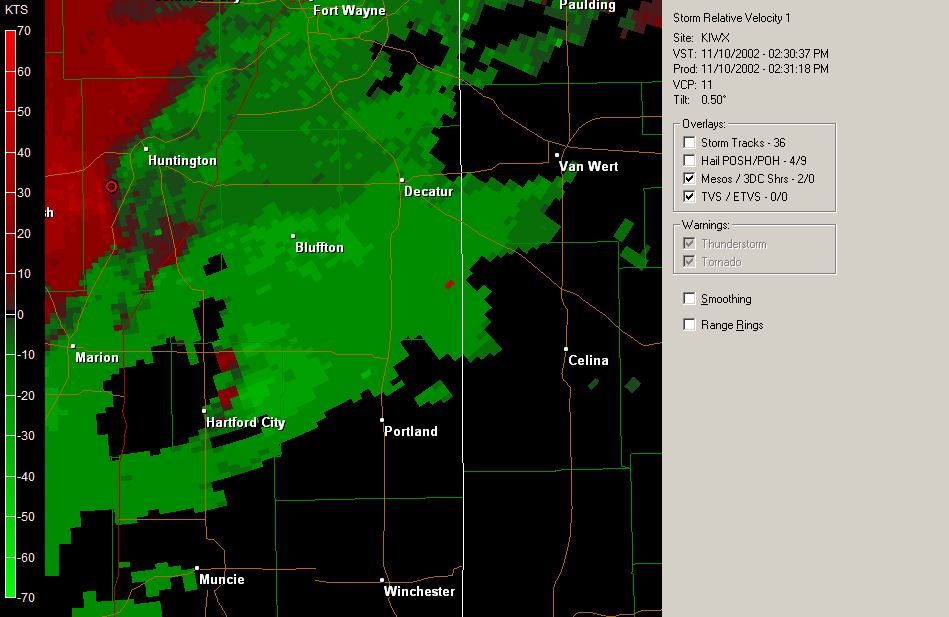
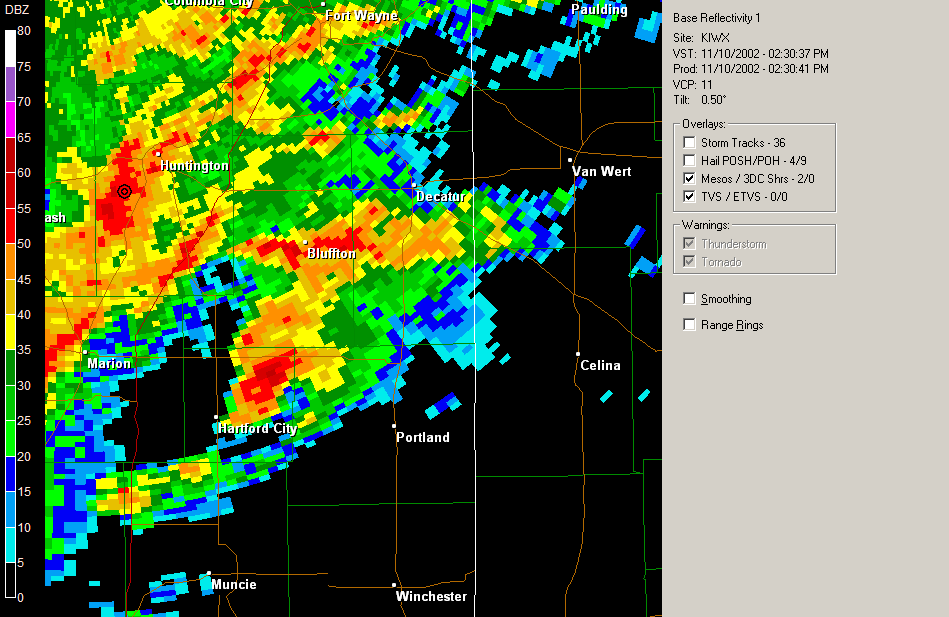
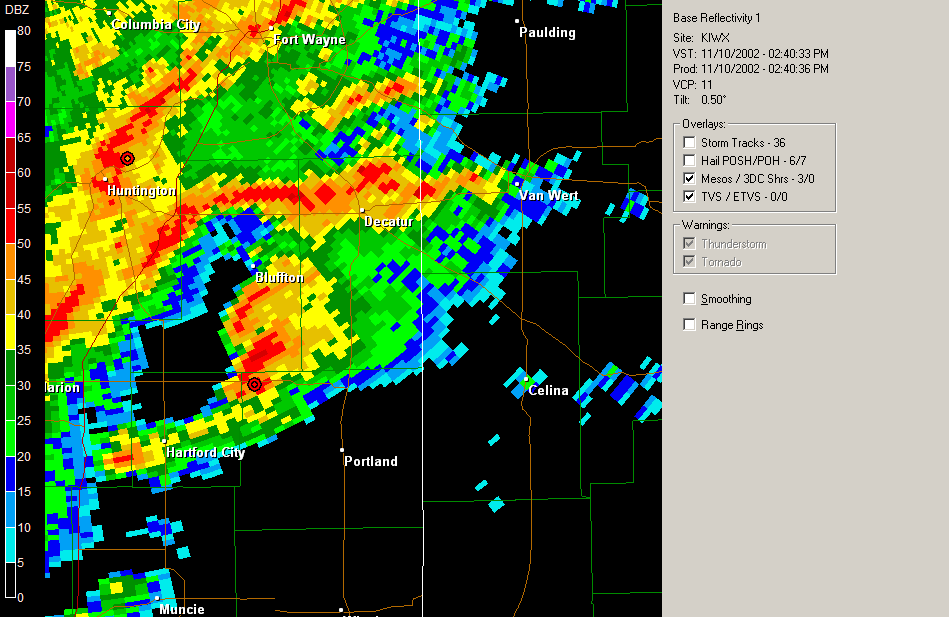
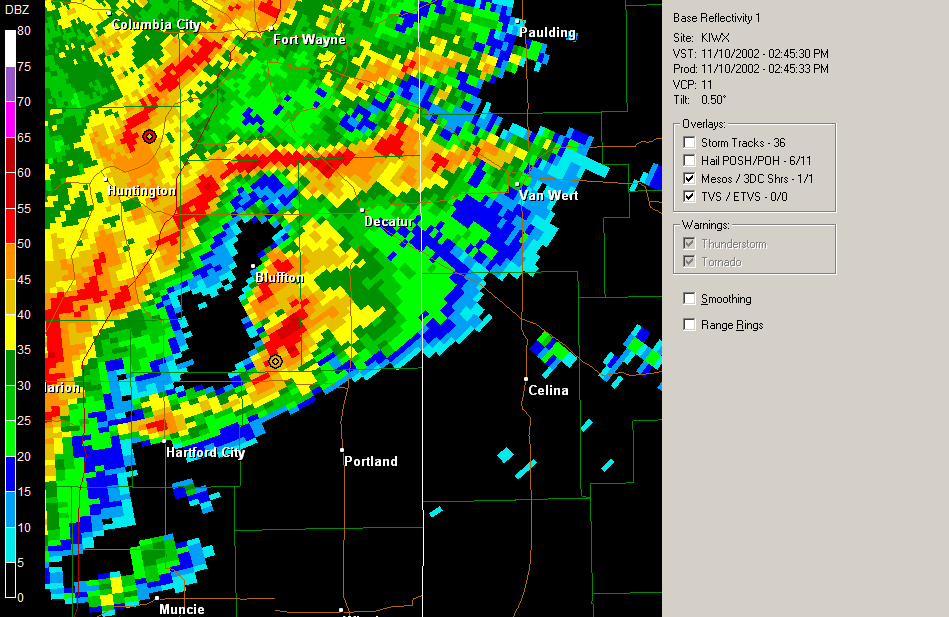
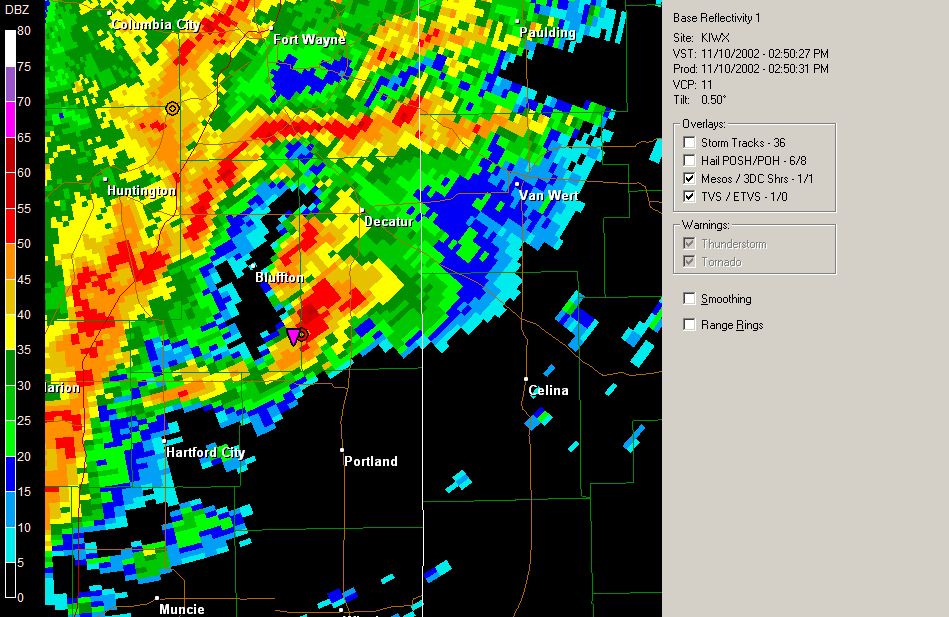
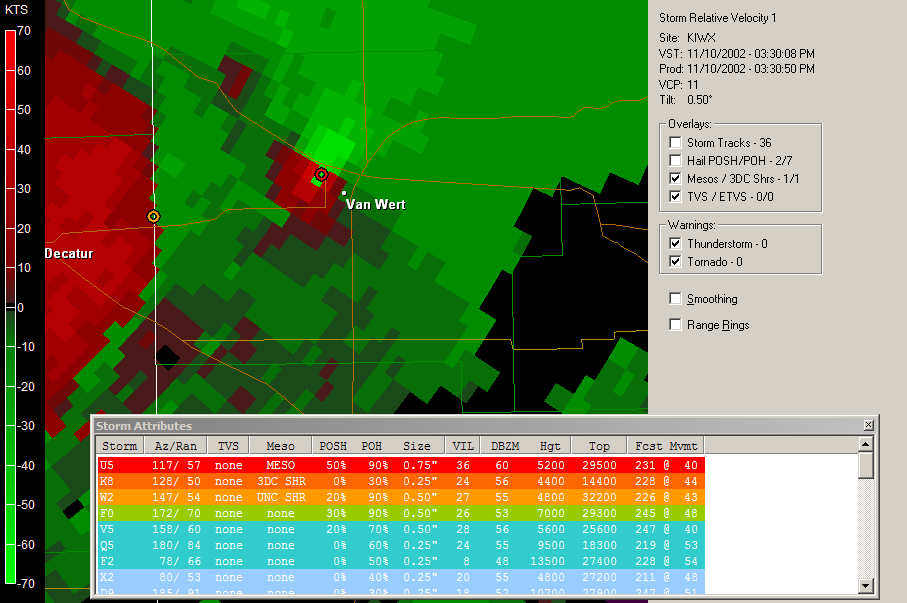
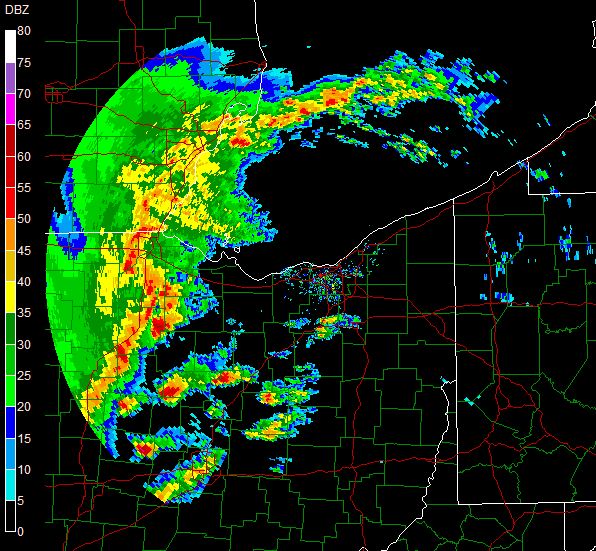
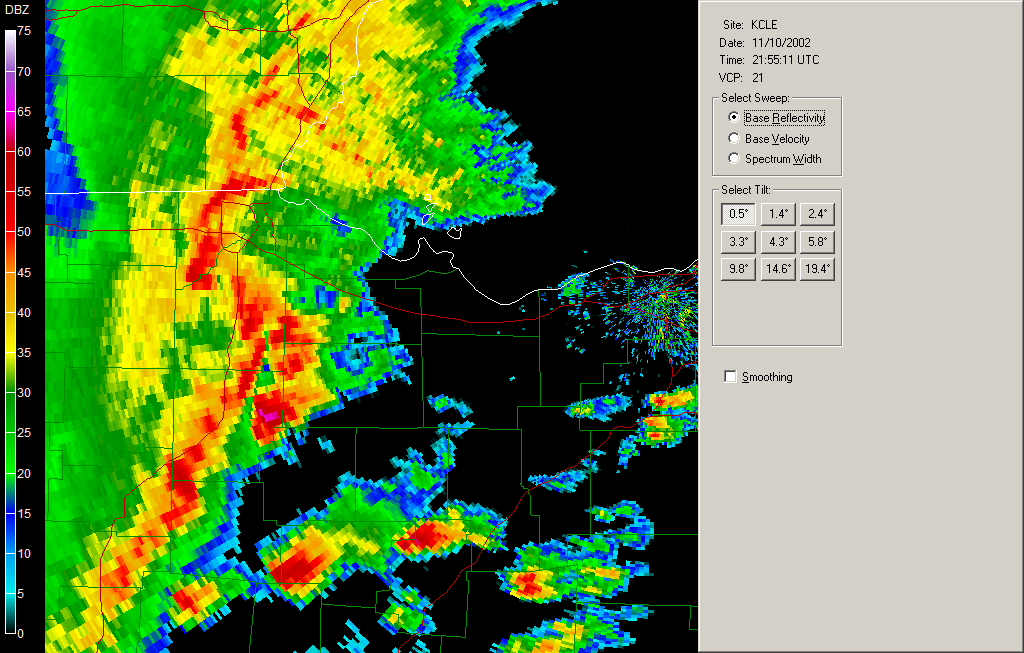
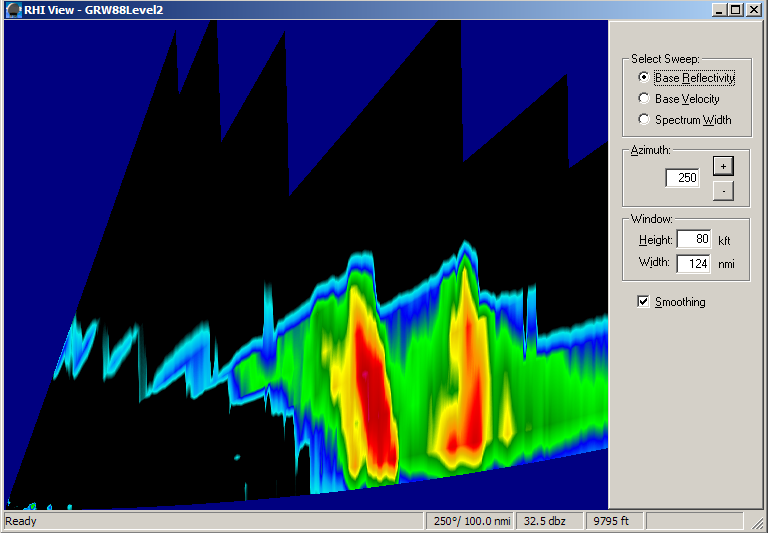
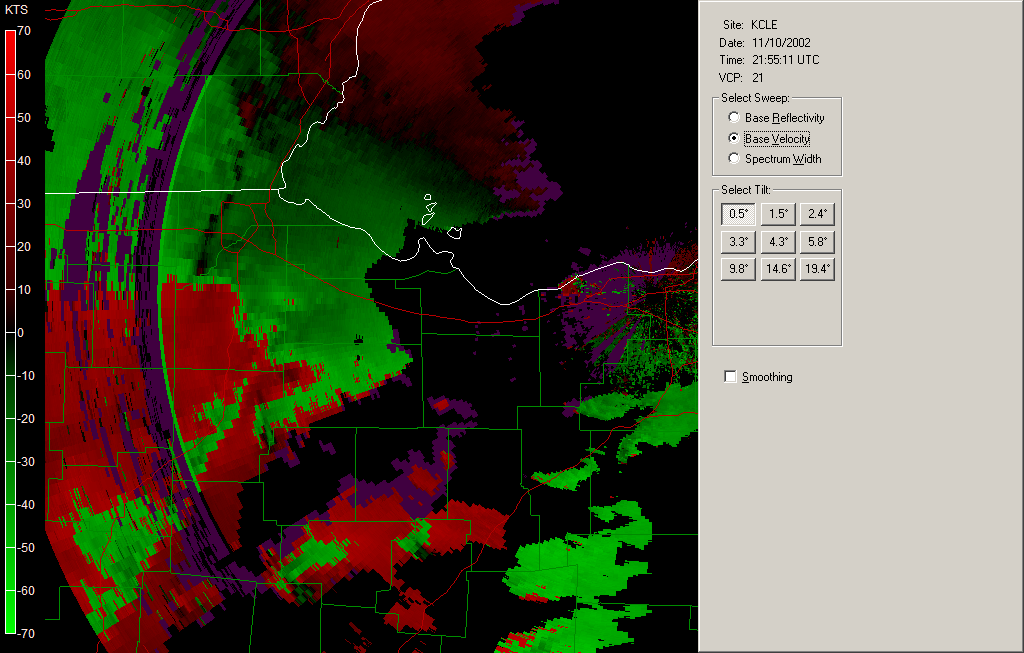
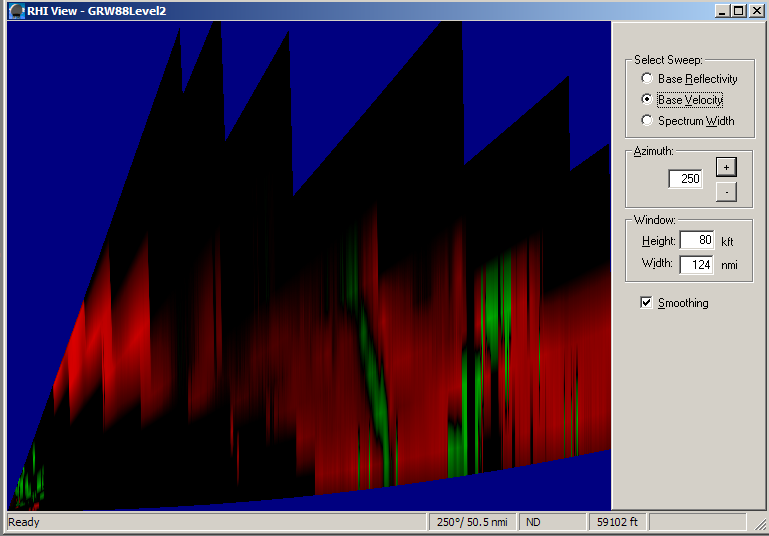
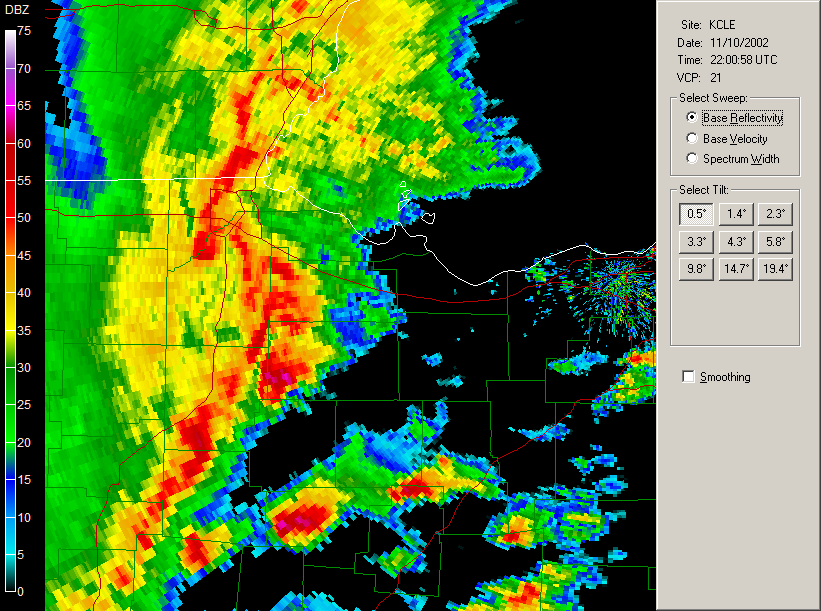
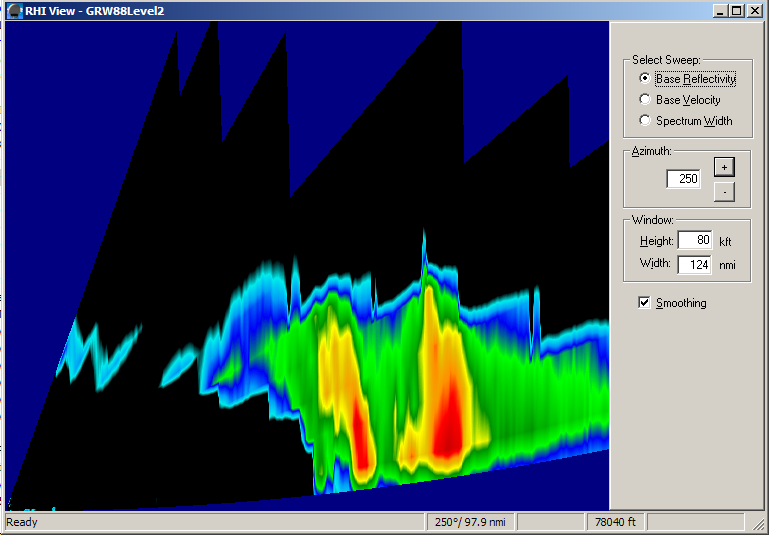
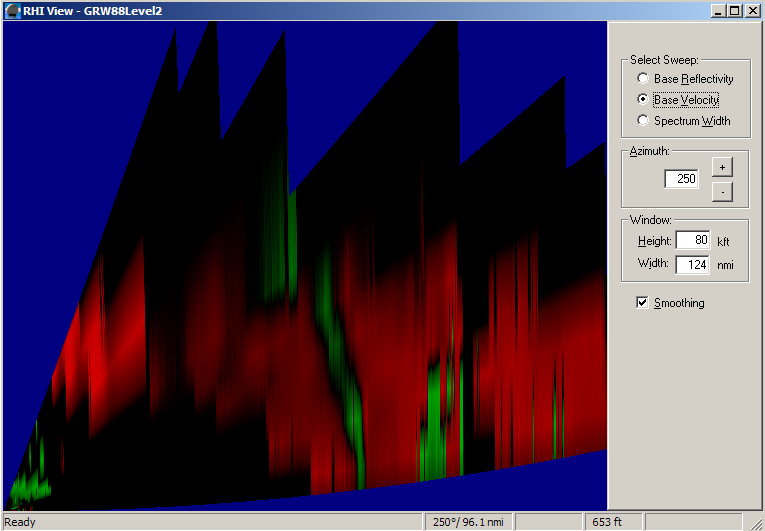
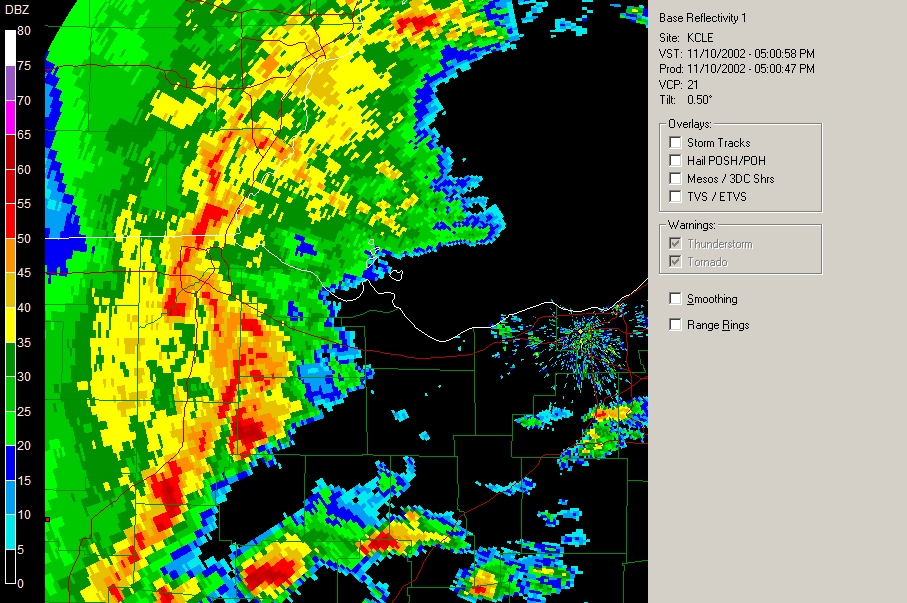
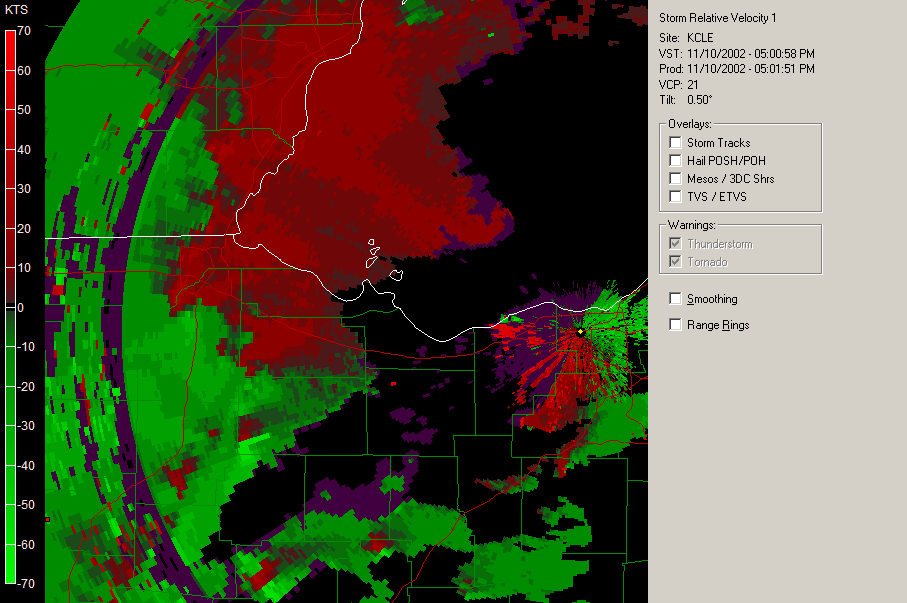
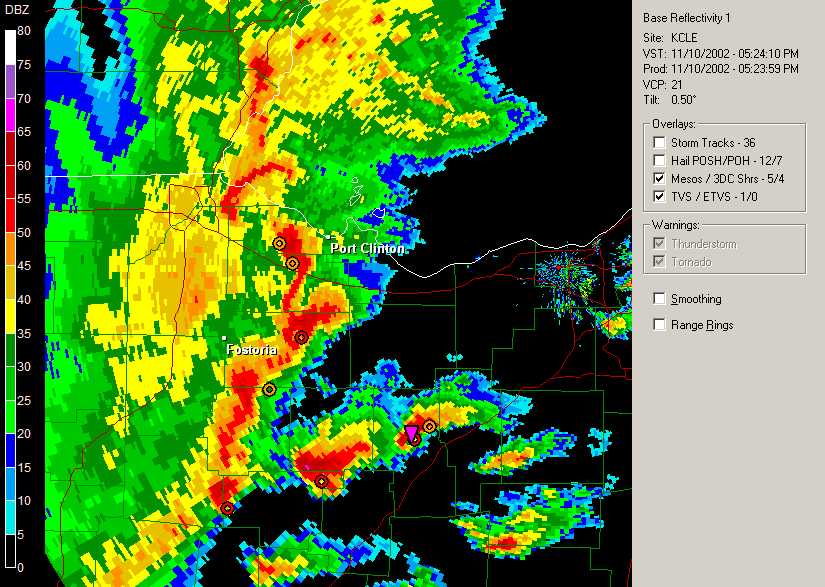
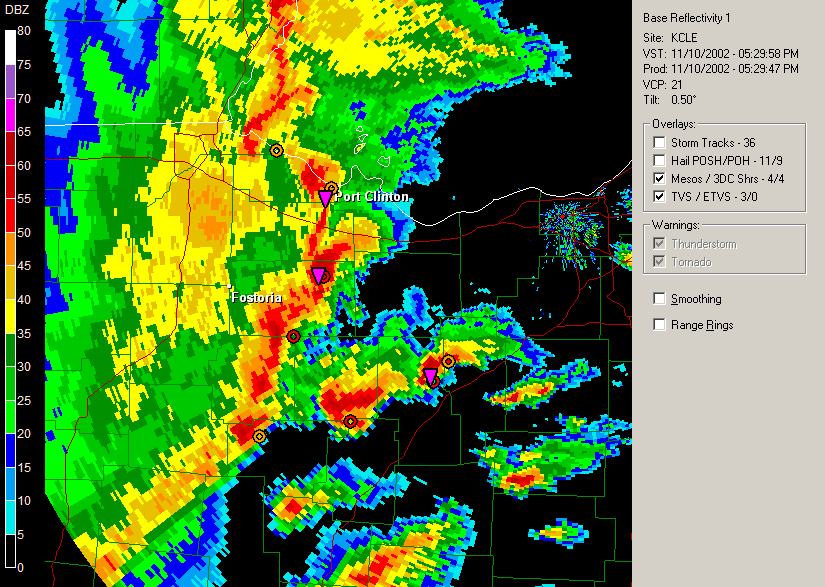
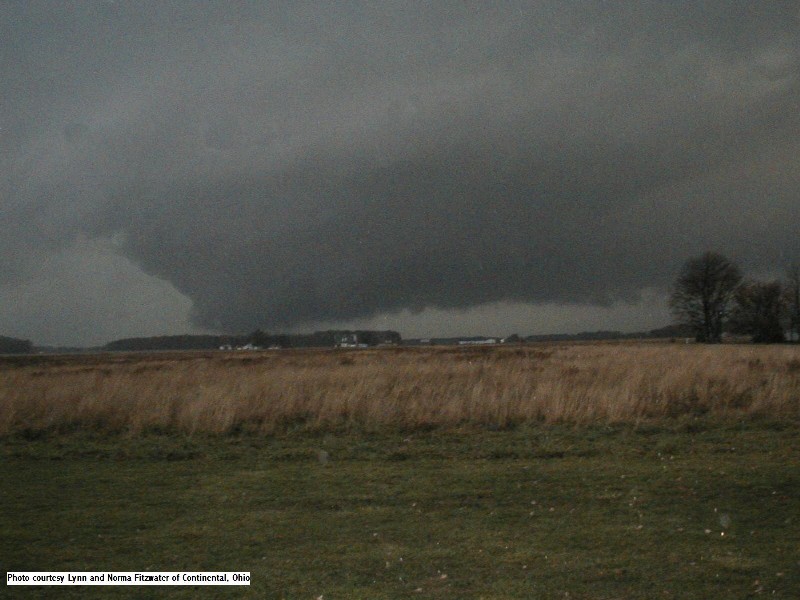
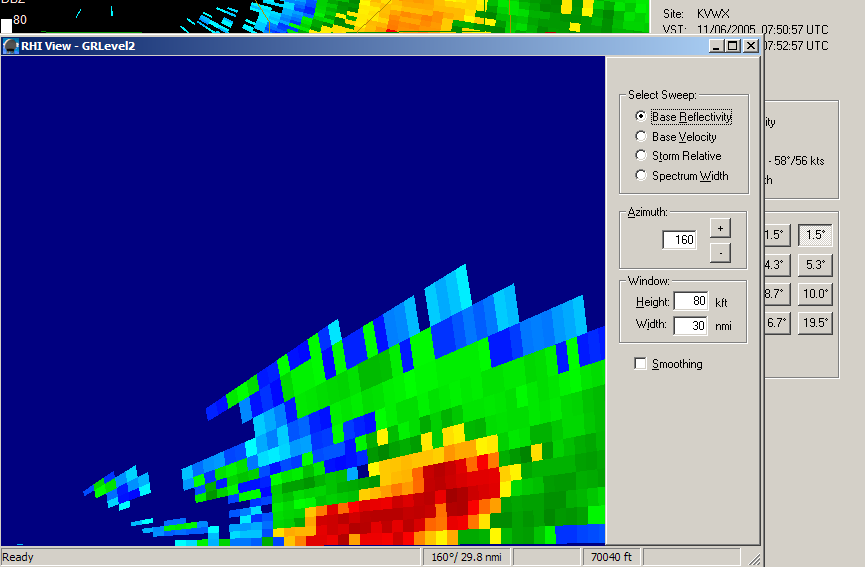
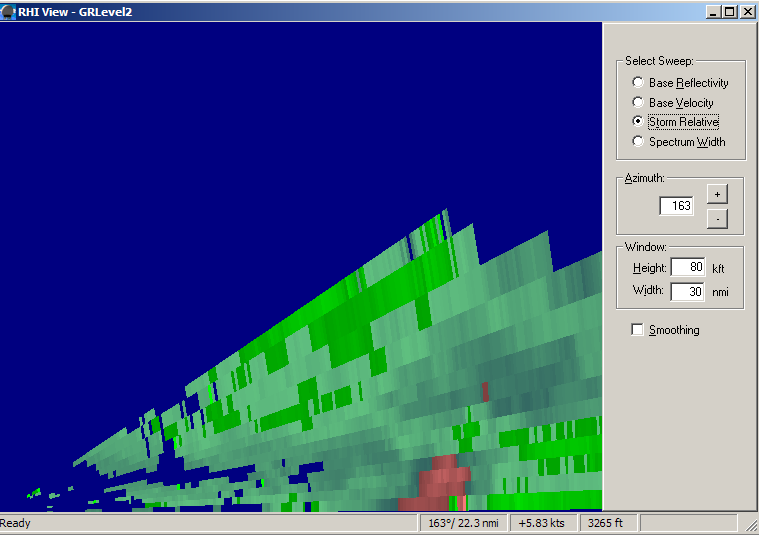
Tornadoes in the Toledo AreaLucas County Tornadoes4/11/1965 (F4) west Toledo to northeast Toledo 4/8/1980 (F2) east Toledo - Oregon 4/17/1981 (F0) Toledo-Rossford 7/12/1992 (F2) Whitehouse area, Anthony Wayne HS-south of Perrysburg 5/9/2000 (F1) Sylvania Wood County Tornadoes 6/8/1953 (F4) southern Wood County to near Cleveland! 8/5/1961 (F0) southeast of Bowling Green 6/24/1968 (F0) north of Bowling Green 5/18/1969 (F0) near Grand Rapids 5/16/1971 (F2) Perrysburg 10/8/1977 (F0) southern Wood County (north of Findlay) 1/11/1980 (F0) Perrysburg 4/3/1980 (F1) Perrysburg 4/8/1980 (F2) southeast of Pemberville 4/17/1981 (F0) Toledo-Rossford 5/2/1983 (F3) Weston - west of Bowling Green 7/12/1992 (F2) Whitehouse area, Anthony Wayne HS-south of Perrysburg 7/12/1992 (F2) Perrysburg 6/4/1996 (F0) Custar 5/9/2000 (F0) Pemberville 5/9/2000 (F0) Hoytville 6/14/2000 (F1) Pemberville 11/10/2002 (F1) Jerry City (south of Bowling Green) 11/10/2002 (F0) Stony Ridge (I-280 and I-80/90 interchange) 11/10/2002 (F1) Millbury March 27, 1991 Storm Reports - a tornado at Nettle Lake, near the border with Indiana and Michigan, actually mostly in Indiana. It started at 0119Z and the one in Hillsdale county started at 0137Z. (8:19PM EST and 8:37PM EST). The F0 tornado just north of Toledo in Lenawee county was at 0238Z or 9:38PM EST. surface chart (Daily Weather Map) at 12z(morning) zoomed in surface chart from the daily weather map at 12z(morning) March 28 (next day) surface chart (Daily Weather Map) at 12z(morning) A complex surface low system - one low at the KS/NE border, and one near Thunder Bay ONT combined and lifted to near the James Bay, ONT/QC border, all within in 24 hours 500mb chart from 12z (morning) 500mb chart from the daily weather map at 12z(morning) 500mb chart from 00z (evening) An upper low in central Nebraska in the morning, a strong southwesterly jet (mid-level) , and by the evening, a shortwave had tracked to IL, cooling the 500mb temp by 2 degrees C at FNT and 5 degrees C at PIA 850mb chart from 12z (morning) 850mb chart from 00z (evening) 850mb temperature contours from 00z (evening) PIA cooled 9 degrees C as a result of the cold front. The 850mb temperatures cooled during the day from about 14-15C to around 12-13C (due to mixing?). This was a factor in the destabilization of the air through the day. In the morning, a very strong low-level jet of 50 knots or better associated with a surface low moving out from the Plains went from from northeast TX to central IL, and then in the evening, it was 40 to 60 knots or more through the whole OH valley and MI. 700mb chart from 00z (evening) 250mb chart from 12z (morning) 250mb chart from 00z (evening) 250mb wind speeds increased from about 70 knots to 80 knots during the day. The area also appears to be in a left exit region of a jet stream that is very noticeable. 23z Regional Surface chart 00z Regional Surface chart 01z Regional Surface chart 02z Regional Surface chart 03z Regional Surface chart 12z negative of Lifted Index and Radar reflectivity (shaded) from Sanders and Doswell 12z surface potential temperature, fronts, and outflow boundaries from Sanders and Doswell March 27 21Z to 23Z Meteograms for Toledo, Fort Wayne, and Jackson, Ann Arbor March 28 00z to 04z Meteograms for Toledo, Fort Wayne, and Jackson, Ann Arbor 00z Surface wind and SLP (NARR) Skew-T for Toledo at 00z (NARR) 00z CAPE/3km Helicity/surface-500mb wind shear composite (NARR) Sounding from Dayton OH (DAY) about 1 hours before the tornado occurred. Sounding from Flint MI (FNT) about 1 hours before the tornado 1occurred. discussion: The data is incomplete, on the DAY sounding, however the helicity and 0-6km shear appear to be excellent anyway. It is likely this type of wind environment with a helicity of 250-300 m2/s2 or even higher existed at Steuben County/Williams County/Hillsdale County at that time. These soundings also look excellent for either supercells or squall lines. The surface winds were south to SSW at 20 knots or more through the day leading up to the tornado, and the morning low was a very warm 57 to 60, the afternoon warmed up to around 68 to 72 in the whole area from Toledo to Fort Wayne to Jackson, the dew point remained around 60 (very high for March). It was cloudy in the morning, possibly remaining cloudy for a lot of the daytime. Outflow boundaries from morning thunderstorms existed in IL, IN, and MI, but seemed to disappear later. The surface dryline and cold front became a single cold front and moved eastward several hundred miles throughout the next 24 hours as the low pressure moved farther north and east. The cold front was coming through IL and western IN, and western MI at 00z and 01z. The winds were veering before the front at 01z. Thunder reported at Saginaw, Flint, Jackson, Fort Wayne, and Peru at 01z. This is indicative of a solid squall line or a broken squall line. At 02z, Fort Wayne had 35 knot winds from the WSW, some 5-10 degrees cooler, Jackson, SW wind and rain, Toledo, Thunderstorm within the hour, S wind, thunder at Flint, Pontiac, Ypsilanti, Toledo, and Findlay. At 03z, Toledo changed to SW wind, 5 to 10 degrees cooler than 2 hours before. My conclusion is the severe thunderstorms were in a line with the cold front, aligned north to south, and moving east to northeast very quickly, and this was effectively a derecho (wind event) as well as tornado and large hail event. The CAPE was about 1250-1500 J/kg at the time and place of the tornado, helicity was around 250-300 m2/s2, 0-6km shear was about 80 knots, all fine for supercell formation. references: NSSL Data Archives F. Sanders and C. Doswell, A Case For Detailed Surface Analysis Bull. Amer. Met. Soc. Vol. 76, No. 4 (1995) pp. 505-521 Daily Weather Maps July 12, 1992 Surface CAPE was 1750 - 2200 J/kg, helicity was 200-300 m^2/s^2, 0-6km shear was 35-40 knots Sounding from Dayton OH (DAY) about 3 hours after the tornado occurred. The helicity (HEL) is excellent and the 0-6km shear is about 35-40 knots and the CAPE is about 1600J/kg 21z Surface wind and SLP (NARR) Skew-T for Toledo at 21z (NARR) 21z CAPE/3km Helicity/surface-500mb wind shear composite (NARR) Other tornado environments May 9, 2000 Sounding from Wilmington OH (ILN) about the time the tornadoes occurred. Note the boundary layer goes up to about 750mb (near dry-adiabatic lapse rates) - this is unusual. Surface Wind (NARR) CAPE/surface-500mb shear/Helicity composite (NARR) Skew-T for Toledo at 00z (NARR) CAPE was about 1000 to 1300 J/kg, Helicity was 100 to 150 m2/s2, 0-6km shear was about 50 knots. June 14, 2000 Sounding from Wilmington OH (ILN) about 3 hours after the tornado occurred. May 2, 1983 Sounding from Dayton OH (DAY) about 3 hours after the tornado occurred. 0-6km shear and helicity (SRH) are excellent and probably the same was true near Toledo. April 11, 1965 Sounding from Dayton OH (DAY) 1 or 2 hours before the Toledo tornado occurred. The data is incomplete, but you can guess that the CAPE could be in the 1000 J/kg range, and the 0-6km shear and helicity (SRH) are excellent and probably the same was true near Toledo. The CAPE on the Toledo Skew-T (reanalysis) was 1300J/kg and the helicity was around 330 m2/s2, with 0-6km shear of around 80 knots. 00z Surface wind and SLP (NCEP) Skew-T for Toledo at 00z (NCEP) 00z Lifted Index/3km Helicity/surface-500mb wind shear composite (NCEP) Storm Reports (courtesy Bangladeshtornadoes.org) Surface analysis at 22z (courtesy Bangladeshtornadoes.org) November 10, 2002 Tornadoes and Severe StormsStorm ReportsTornado paths graphic (preliminary surveys by the NWS) The most damaging tornadoes were the Van Wert and Continental (F4) 90-mile-long track tornado, Fostoria (F2), and Port Clinton (F2), an (F3) in Seneca County and an (F3) in Adams County, Indiana. These were produced by supercells, the first of which formed in northeast Indiana near Hartford City, in Blackford County Skew-T for Findlay at 18z (NARR) Skew-T for Findlay at 21z (NARR) 15z CAPE/3km Helicity/surface-500mb wind shear composite (NARR) 15z Surface wind and SLP (NARR) 18z CAPE/3km Helicity/surface-500mb wind shear composite (NARR) 18z Surface wind and SLP (NARR) 21z CAPE/3km Helicity/surface-500mb wind shear composite (NARR) 21z Surface wind and SLP (NARR) discussion: Surface CAPE was 50 to 100 J/kg, helicity (SRH) was 150 to 200 m^2/s^2, 0-6km shear was 45-50 knots, my guess is that 0-1km EHI may have been as high as 0.8 to 1.5, at around 20Z or 21Z, based on Earl Barker's Page Historical Section 0-1km EHI. Sounding from Wilmington OH (ILN) about 8 hours before the first tornado occurred. Sounding from Wilmington OH (ILN) about 4 hours after the first tornado occurred, or less than 4 hours from the time most of the tornadoes occurred. The data is incomplete, but you can see that the helicity (SRH) should have been more than 615 m^2/s^2, and the 0-6km shear and CAPE are unknown. Sounding from Pontiac/Detroit (DTX) after the tornado occurred. This is kind of unimpressive except for the 0-6km shear. Sounding from Pontiac/Detroit (DTX). I modified this to include some possibilities of what the sounding might have looked like in NW OH in the afternoon. The blue lines are possible temperature profiles. The green line is the parcel profile with a surface temperature of about 70F, dew point of 61F (21C, 16C). So the sounding may have had over 500 J/kg of CAPE after all. There may have been a "skinny" CAPE of about 300-700 J/kg in NW OH. It is still somewhat puzzling how a low-CAPE environment produced a monster F4 tornado. Start Times of the tornadoesWells County 1946z (2:46pm)Adams County 1958z (2:58pm) Van Wert 2015z (3:15pm) Fostoria 2157z (4:57pm) Seneca County 2215z (5:15pm) Sandusky County 2219z (5:19pm) Port Clinton 2230z (5:30pm) completely in Huron County 2242z (5:42pm) western Richland County 2245z (5:45pm) Erie County 2249z (5:49pm) Van Wert Tornado LoopsBase Reflectivity 1 Base Reflectivity 2 Storm Relative Velocity 1 Storm Relative Velocity 1 - Zoomed in Range-Height Base Reflectivity Range-Height Storm Relative Velocity Radar images1930z IWX storm relative velocity 1 zoomed on NE Indiana 1930z_IWX_base_reflectivity_1_zoomed on NE Indiana 1940z_IWX_base_reflectivity_1_zoomed on NE Indiana 1945z_IWX_base_reflectivity_1_zoomed on NE Indiana 1950z_IWX_base_reflectivity_1_zoomed on NE Indiana 2030z_IWX_storm_rel_velocity_1 zoomed on Van Wert Tornado 2155Z_CLE_base_reflecticity_1 2155z_CLE_base_reflectivity_1_zoomed on NW Ohio 2155z_CLE_base_reflectivity_range-height_focused on storm near Fostoria 2155z_CLE_base_velocity_1_zoomed on NW Ohio 2155z_CLE_base_velocity_range-height focused on storm near Fostoria 2200z_CLE_base_reflectivity_1_zoomed on NW Ohio - Fostoria Tornado was occurring 2200z_CLE_base_reflectivity_range-height focused on storm near Fostoria 2200z_CLE_base_velocity_range-height focused on storm near Fostoria 2200z_CLE_level 3 nexrad_base_reflectivity_1_zoomed on NW Ohio - Fostoria Tornado was occuring 2200z_CLE_level 3 nexrad_storm_rel_velocity_1_zoomed on NW Ohio - Fostoria Tornado was occurring 2224z_CLE_base_reflectivity_1 zoomed on NW Ohio- Seneca County Tornado occurring 2229z_CLE_base_reflectivity_1 zoomed on NW Ohio - Port Clinton Tornado was occurring Surface Images from Nov. 10 Satellite Images from Nov. 10 Extra Radar images from Nov. 10 Eta Model images from Nov. 10 SPC Stuff from Nov. 10 Picture of tornado at Continental OH November 6, 2005 Evansville Tornado(this is not in the Toledo area, but I wanted to include it anyway) Base Reflectivity 1 Loop Base Reflectivity 2 Loop Storm Relative Velocity 1 Loop Storm Relative Velocity 2 Loop Range-Height Reflectivity centered on the storm Range-Height Storm Relative Velocity centered on the storm |